

`
Exciting News: Paid Subscriptions Have Launched! 🚀
On September 1, we officially rolled out our new paid subscription plans at GuruFinance Insights, offering you the chance to take your investing journey to the next level! Whether you're just starting or are a seasoned trader, these plans are packed with exclusive trading strategies, in-depth research paper analysis, ad-free content, monthly AMAsessions, coding tutorials for automating trading strategies, and much more.
Our three tailored plans—Starter Investor, Pro Trader, and Elite Investor—provide a range of valuable tools and personalized support to suit different needs and goals. Don’t miss this opportunity to get real-time trade alerts, access to masterclasses, one-on-one strategy consultations, and be part of our private community group. Click here to explore the plans and see how becoming a premium member can elevate your investment strategy!
Check Out Latest Premium Articles


Candlestick patterns play a pivotal role in technical analysis, offering insights into potential market movements based on historical price data. Traders and analysts often rely on these patterns to make informed decisions, whether it’s to buy, sell, or hold assets. But how do you identify these patterns programmatically, especially using Python?
In this article, we’ll dive into the fascinating world of candlestick patterns and explore two different ways to identify them in Python. First, we’ll harness the power of the Ta-Lib library, a popular tool among financial analysts. Then, we’ll take things a step further by manually defining formulas to spot these patterns on our own.
But before we get our hands dirty with code, let’s quickly go over some of the key candlestick patterns we’ll be focusing on:
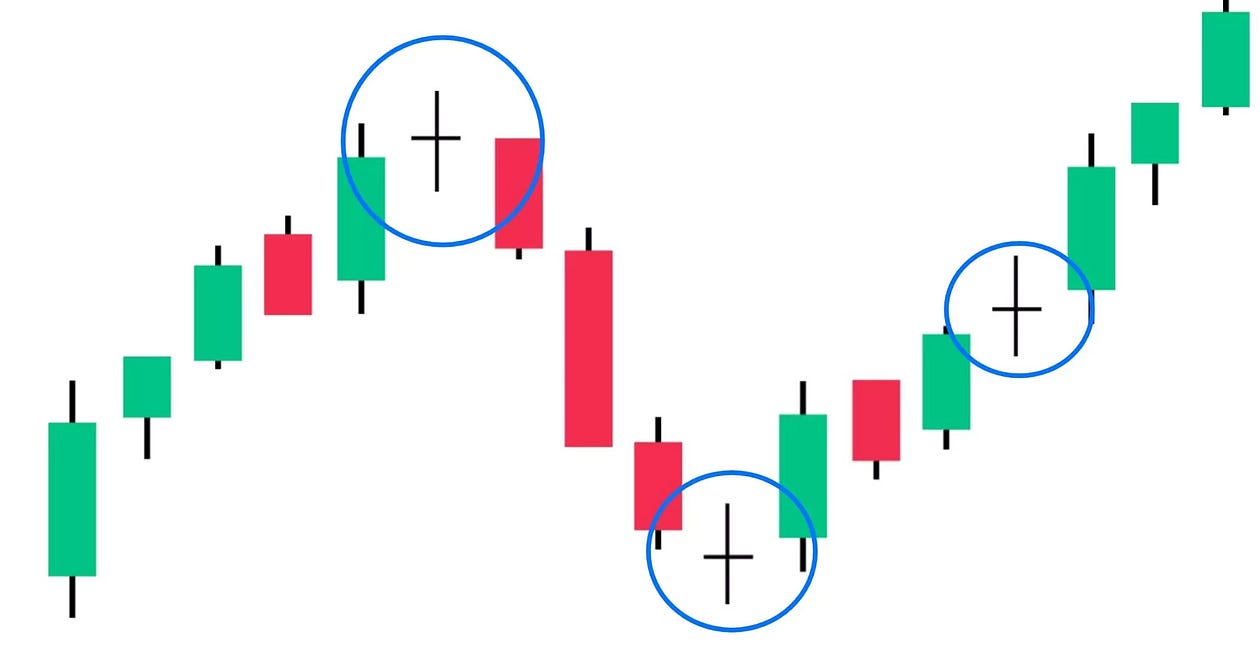
Doji: This pattern forms when a security’s open and close prices are virtually the same, creating a cross or plus sign. It indicates indecision in the market and often precedes a price reversal.
Harami: A two-candle pattern where a small body candle is completely contained within the previous candle’s large body. This pattern suggests a potential reversal, with the direction depending on whether it appears in an uptrend or downtrend.
Engulfing: This pattern occurs when a larger candle completely engulfs the body of the previous candle. A bullish engulfing suggests a potential upward reversal, while a bearish engulfing hints at a downward reversal.
Morning Star: A three-candle pattern that signals the end of a downtrend and the start of an uptrend. It begins with a large bearish candle, followed by a small-bodied candle (which could be bullish or bearish), and ends with a large bullish candle.
Hammer: A single candle pattern that has a small body with a long lower shadow. It usually occurs at the bottom of a downtrend and suggests a potential upward reversal.
I. Using Ta-Lib to Identify Candlestick Patterns
Now that we’ve got a basic understanding of these patterns, let’s jump into how we can use the Ta-Lib library in Python to identify them.
First, we’ll need to import the necessary libraries and download historical data for the S&P500 index. Ta-Lib makes it incredibly easy to recognize patterns by providing pre-built functions for each of them.
import pandas as pd
import yfinance as yf
import talib

sp500_ticker = "^GSPC"

df = yf.download(sp500_ticker, start="2024-07-10", end="2024-08-14", interval='5m')
We’re using the yfinance library to download historical market data for the S&P 500 index, represented by the ticker ^GSPC. Specifically, we're fetching data from July 10, 2024, to August 14, 2024, with each data point representing a 5-minute interval.
op = df['Open'].astype(float)
hi = df['High'].astype(float)
lo = df['Low'].astype(float)
cl = df['Close'].astype(float)op, hi, lo, cl: These variables store the 'Open', 'High', 'Low', and 'Close' prices from the dataframe. We convert these to float to ensure compatibility with Ta-Lib functions, as Ta-Lib requires numerical inputs to perform its calculations.
df['DOJI'] = talib.CDLDOJI(op, hi, lo, cl)
df['Engulfing'] = talib.CDLENGULFING(op, hi, lo, cl)
df['HAMMER'] = talib.CDLHAMMER(op, hi, lo, cl)
df['HANGINGMAN'] = talib.CDLHANGINGMAN(op, hi, lo, cl)
df['HARAMI'] = talib.CDLHARAMI(op, hi, lo, cl)
df['MORNINGSTAR'] = talib.CDLMORNINGSTAR(op, hi, lo, cl)
Each of these functions (e.g., CDLDOJI, CDLENGULFING, etc.) is part of Ta-Lib and is designed to detect specific candlestick patterns. When a pattern is identified on a given day (or period), the function returns a non-zero value for that particular row in the dataframe.
For example, CDLDOJI(op, hi, lo, cl) will return 100, -100, or 0 depending on whether a Doji pattern is identified. Positive values typically indicate a bullish pattern, while negative values indicate a bearish pattern.
# Counting occurrences of each pattern
pattern_counts = df[['DOJI', 'Engulfing', 'HAMMER', 'HANGINGMAN',
                     'HARAMI',
                     'MORNINGSTAR']].apply(lambda x: x[x != 0].count())

print("Candlestick Patterns Identified Across the Given Period:")
print(pattern_counts)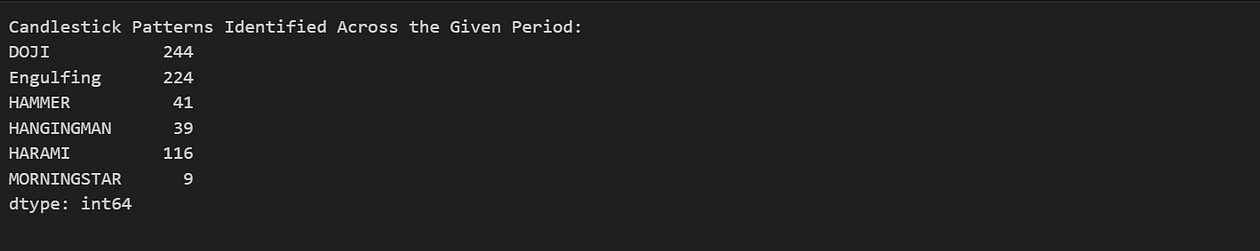
apply(lambda x: x[x != 0].count()): Lambda function goes through each column corresponding to a candlestick pattern and counts the number of non-zero entries. A non-zero value in these columns indicates that the corresponding pattern has been identified on that specific row (timestamp).
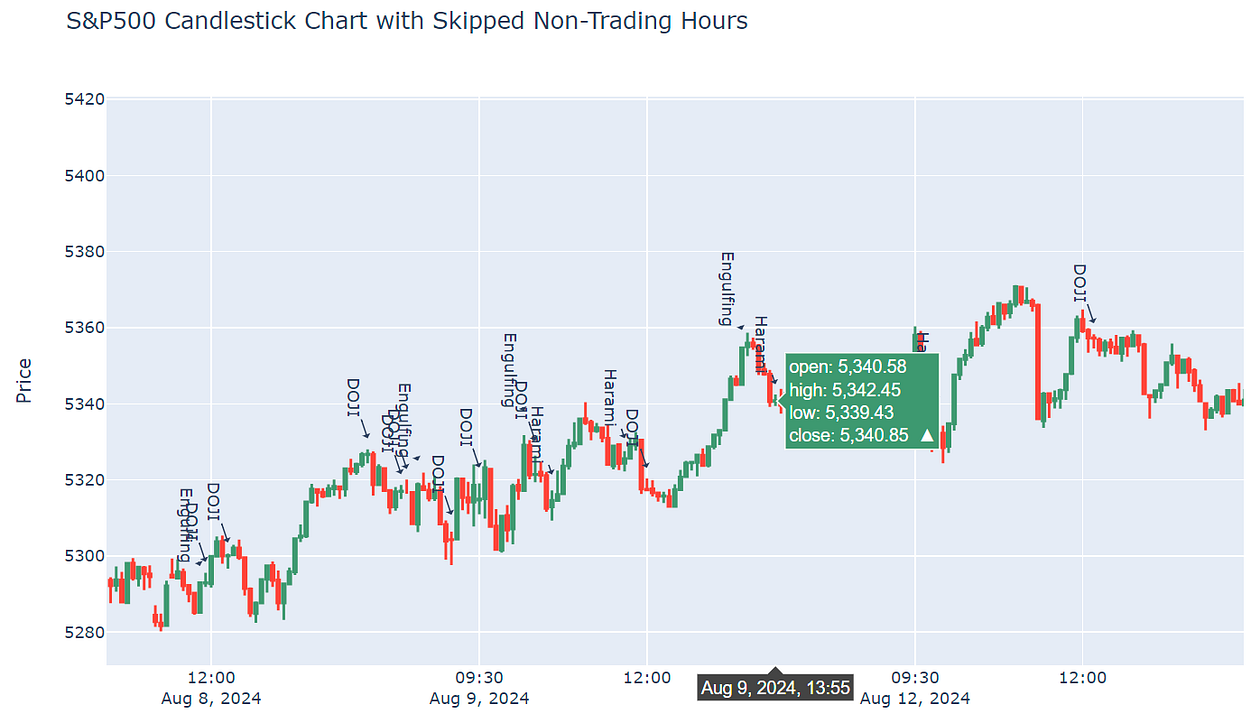
S&P 500 Candlestick Chart Highlighting Detected Patterns using Ta-Lib: Doji, Engulfing, Harami — Visualizing Pattern Recognition with Skipped Non-Trading Hours
II. Identifying Candlestick Patterns through Formulas
In the first part of our analysis, we explored how to identify key candlestick patterns using the Ta-Lib library in Python. Now, we’re going to shift gears and dive into identifying these patterns manually by implementing the underlying formulas directly in our code. This method gives us more control and flexibility over the pattern detection process, allowing for custom adjustments and a deeper understanding of how these patterns are formed.
Let’s break down the process of identifying various candlestick patterns using custom formulas and the numpy library.
1. Calculating Additional Metrics: AVGH10, AVGL10, MINL10, and STOC1
To identify patterns like the Doji, Engulfing, Morning Star, Harami, and Hammer, we first need to calculate several metrics that will be used in our pattern recognition formulas
AVGH10 = df['High'].rolling(window=10).mean()
AVGL10 = df['Low'].rolling(window=10).mean()
MINL10 = df['Low'].rolling(window=10).min()
STOC1 = 100 * (df['Close'] - MINL10) / (AVGH10 - MINL10)AVGH10: This is the 10-period moving average of the high prices. It gives us the average high over the last 10 candles.AVGL10: Similarly, this is the 10-period moving average of the low prices.MINL10: This metric represents the minimum low price over the last 10 periods.STOC1: The stochastic oscillator is a momentum indicator comparing the closing price to the range of prices over a given period. Here, we calculate it using the formula for %K:STOC1 = 100 * (df['Close'] - MINL10) / (AVGH10 - MINL10).
2. Identifying the Doji Pattern
df['DOJI'] = np.where(
    (20 * abs(df['Open'] - df['Close']) <= df['High'] - df['Low']) &
    (~df[['High', 'Low', 'Open', 'Close']].isna().any(axis=1)),
    1,
    0
)
Doji Identification: A doji (dо̄ji) is a name for a trading session in which a security has open and close levels that are virtually equal, as represented by a candle shape on a chart. In our formula:
20 * abs(df['Open'] - df['Close']) <= df['High'] - df['Low']: This checks if the difference between the open and close prices is small relative to the range of the candle (High-Low). Multiplying by 20 emphasizes the requirement for a small body.The
np.wherefunction is used to assign a value of1where the Doji pattern is identified and0otherwise.
3. Identifying the Bullish Engulfing Pattern
O1 = df['Open'].shift(1)
C1 = df['Close'].shift(1)

df['Engulfing'] = np.where(
    (O1 > C1) &
    (10 * (df['Close'] - df['Open']) >= 7 * (df['High'] - df['Low'])) &
    (df['Close'] > O1) &
    (C1 > df['Open']) &
    (10 * (df['High'] - df['Low']) >= 12 * (AVGH10 - AVGL10)) &
    (~np.isnan(AVGH10) & ~np.isnan(AVGL10)),
    1,
    0
)
Engulfing Identification: The Engulfing pattern typically involves a large candle that “engulfs” the previous smaller candle.
(O1 > C1): This checks that the previous candle was bearish (Open > Close).10 * (df['Close'] - df['Open']) >= 7 * (df['High'] - df['Low']): This ensures the current candle is significantly larger than the previous one.
4. Identifying the Morning Star Pattern
O2 = df['Open'].shift(2)
C2 = df['Close'].shift(2)
H2 = df['High'].shift(2)
L2 = df['Low'].shift(2)

df['MorningStar'] = np.where(
    (O2 > C2) &
    (5 * (O2 - C2) > 3 * (H2 - L2)) &
    (C2 > O1) &
    (2 * abs(O1 - C1) < abs(O2 - C2)) &
    (H1 - L1 > 3 * (C1 - O1)) &
    (df['Close'] > df['Open']) &
    (df['Open'] > O1) &
    (df['Open'] > C1) &
    ((~np.isnan(O2) & ~np.isnan(C2) & ~np.isnan(O1) & ~np.isnan(H1))),
    1,
    0
)
Morning Star Identification: The Morning Star is a three-candle pattern signaling a potential reversal from a downtrend to an uptrend.
(O2 > C2): The first candle is bearish.(5 * (O2 - C2) > 3 * (H2 - L2)): The first candle’s body must be relatively large.(C2 > O1): The second candle (small-bodied or a Doji) shows indecision.(df['Close'] > df['Open']): The third candle is bullish, confirming the reversal.
5. Identifying the Harami Pattern
AVGH10_1 = df['High'].shift(1).rolling(window=10).mean()
AVGL10_1 = df['Low'].shift(1).rolling(window=10).mean()

df['Harami'] = np.where(
    (10 * (O1 - C1) >= 7 * (H1 - L1)) &
    (H1 - L1 >= AVGH10_1 - AVGL10_1) &
    (df['Close'] > df['Open']) &
    (df['Open'] > C1) &
    (O1 > df['Close']) &
    (6 * (O1 - C1) >= 10 * (df['Close'] - df['Open'])),
    1,
    0
)
Harami Identification: The Harami pattern is characterized by a smaller candle that fits entirely within the previous larger candle’s body.
The formula checks that the previous candle was relatively large (
O1 - C1 >= 7 * (H1 - L1)).The current candle is smaller (
6 * (O1 - C1) >= 10 * (df['Close'] - df['Open'])).
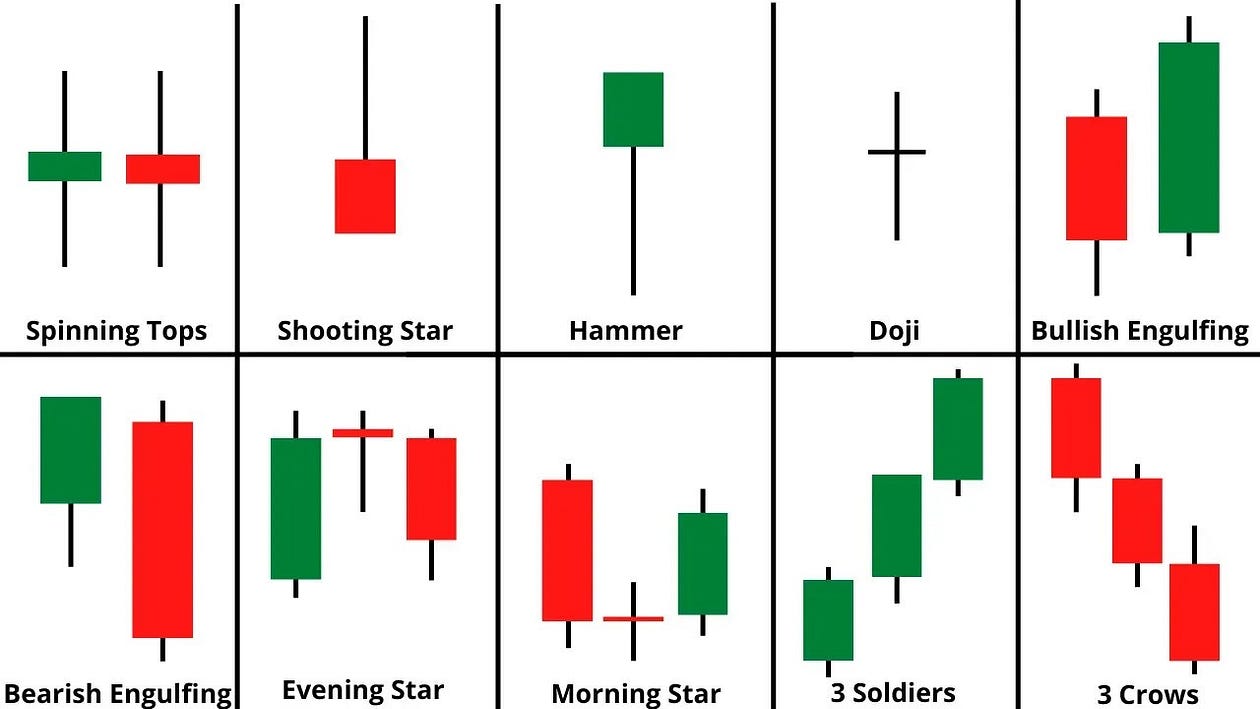
Popular Candlestick Patterns
6. Summarizing the Identified Patterns
pattern_counts = df[['DOJI', 'Engulfing', 'Hammer',
                      'Harami',
                      'MorningStar']].apply(lambda x: (x != 0).sum())

print(pattern_counts)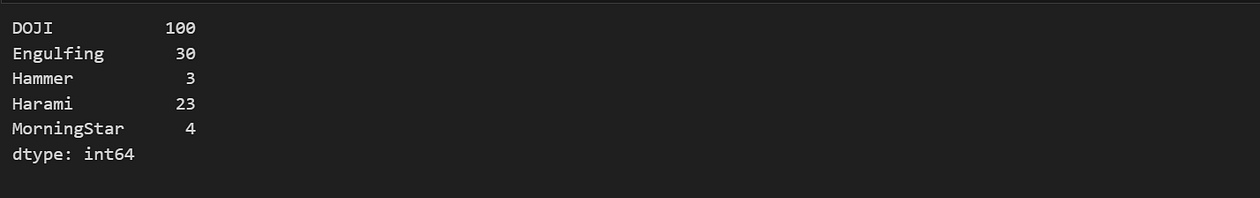
We detected several key candlestick patterns using custom formulas. The DOJI pattern appeared 100 times, indicating market indecision. The Engulfing pattern was found 30 times, suggesting potential reversals. We also identified the Hammer 3 times, the Harami 23 times, and the Morning Star 4 times, each pointing to possible trend changes.

S&P 500 Candlestick Chart Highlighting Detected Patterns using formula’s: Doji, Engulfing, Harami — Visualizing Pattern Recognition with Skipped Non-Trading Hours
Conclusion
In this blog, we explored two methods for identifying candlestick patterns in Python — using the Ta-Lib library and custom formulas. Both approaches successfully identified key patterns like Doji, Engulfing, Hammer, Harami, and Morning Star, though the detection frequency varied.
The differences in pattern counts highlight the importance of understanding the underlying algorithms and conditions in pattern recognition. While Ta-Lib offers a quick and comprehensive solution, custom formulas provide a more tailored approach, offering deeper insights into market behavior.
Each method has its merits, depending on whether you need a quick implementation or a more granular, customized analysis. Either way, programmatically identifying candlestick patterns can significantly enhance your trading and market analysis strategies.
The complete code for these notebooksis available on GitHub: https://github.com/adikul25/candle_pattern_identification.