
In partnership with

Big Tech Has Spent Billions Acquiring AI Smart Home Startups

The pattern is clear: when innovative companies successfully integrate AI into everyday products, tech giants pay billions to acquire them.
Google paid $3.2B for Nest.
Amazon spent $1.2B on Ring.
Generac spent $770M on EcoBee.
Now, a new AI-powered smart home company is following their exact path to acquisition—but is still available to everyday investors at just $1.90 per share.
With proprietary technology that connects window coverings to all major AI ecosystems, this startup has achieved what big tech wants most: seamless AI integration into daily home life.
Over 10 patents, 200% year-over-year growth, and a forecast to 5x revenue this year — this company is moving fast to seize the smart home opportunity.
The acquisition pattern is predictable. The opportunity to get in before it happens is not.
Past performance is not indicative of future results. Email may contain forward-looking statements. See US Offering for details. Informational purposes only.
🚀 Your Investing Journey Just Got Better: Premium Subscriptions Are Here! 🚀
It’s been 4 months since we launched our premium subscription plans at GuruFinance Insights, and the results have been phenomenal! Now, we’re making it even better for you to take your investing game to the next level. Whether you’re just starting out or you’re a seasoned trader, our updated plans are designed to give you the tools, insights, and support you need to succeed.
Here’s what you’ll get as a premium member:
Exclusive Trading Strategies: Unlock proven methods to maximize your returns.
In-Depth Research Analysis: Stay ahead with insights from the latest market trends.
Ad-Free Experience: Focus on what matters most—your investments.
Monthly AMA Sessions: Get your questions answered by top industry experts.
Coding Tutorials: Learn how to automate your trading strategies like a pro.
Masterclasses & One-on-One Consultations: Elevate your skills with personalized guidance.
Our three tailored plans—Starter Investor, Pro Trader, and Elite Investor—are designed to fit your unique needs and goals. Whether you’re looking for foundational tools or advanced strategies, we’ve got you covered.
Don’t wait any longer to transform your investment strategy. The last 4 months have shown just how powerful these tools can be—now it’s your turn to experience the difference.

Elaborated with Python
In today’s market landscape, the “Magnificent Seven” technology companies — Apple, Microsoft, Google, Amazon, NVIDIA, Meta, and Tesla — have become central to many investment portfolios. Their dominance in market capitalization and influence on major indices necessitates sophisticated approaches to portfolio management. This article explores an advanced quantitative strategy that combines Hierarchical Risk Clustering (HRC) with dynamic risk management to optimize exposure to these market leaders while maintaining robust risk controls.
The Foundation: Hierarchical Risk Clustering
The strategy’s cornerstone lies in its sophisticated approach to portfolio construction using HRC. Unlike traditional portfolio optimization methods that can be sensitive to estimation errors, HRC provides a more robust framework for understanding and managing the relationships between assets.
Clustering Methodology
The process begins by transforming correlations between assets into distances using the formula √(2(1-ρ)).
This transformation creates a distance matrix that serves as the foundation for hierarchical clustering. The Ward linkage method is then applied to form clusters that minimize intra-cluster variance while maximizing inter-cluster differences.
This approach offers significant advantages over traditional methods. By recognizing natural groupings in the technology sector, the clustering helps identify underlying relationships that might not be immediately apparent. The method’s robustness to estimation errors in correlation matrices makes it particularly valuable for portfolio management, as these errors can significantly impact traditional optimization approaches. Furthermore, the hierarchical structure tends to produce more stable portfolio allocations over time, reducing unnecessary turnover and associated costs.
Hands Down Some Of The Best Credit Cards Of 2025
Pay No Interest Until Nearly 2027 AND Earn 5% Cash Back
Capital Allocation Strategy
The portfolio construction follows a two-tier approach that balances diversification with optimal risk allocation. At the cluster level, capital is distributed equally across identified groups, providing natural diversification at the macro level. This approach helps mitigate concentration risk despite the focused nature of the technology sector portfolio.
Within each cluster, the strategy employs inverse variance weighting, a sophisticated approach that optimizes the risk-return profile at the local level. This method automatically adjusts to changing volatility conditions, giving more weight to more stable assets within each group while maintaining the broader diversification benefits of the cluster structure.
Dynamic Risk Management Framework
The strategy implements a sophisticated multi-temporal risk management system that operates across different time horizons, creating a comprehensive approach to risk control that adapts to varying market conditions.
Risk Control Layers
The system employs three interconnected layers of protection, each serving a specific purpose in the overall risk management framework. The daily monitoring layer forms the first line of defense, utilizing Value at Risk (VaR) calculations at a 99% confidence level. This is complemented by rolling volatility analysis using a 252-day window, providing immediate response capabilities to market changes.
The weekly aggregation layer adds a medium-term perspective, analyzing five-day return windows and implementing time-adjusted VaR calculations. This layer helps identify developing trends and potential risks that might not be apparent in daily data. The system propagates risk signals progressively, ensuring coherent risk management across time frames.
Monthly oversight provides the final layer of protection, incorporating a maximum drawdown threshold of -20% and integrating lower-frequency signals. This longer-term perspective helps maintain strategic positioning while protecting against sustained adverse market movements.
Risk Signal Integration
The framework creates a unified risk management system through sophisticated signal integration. Risk signals propagate across time frames through a carefully designed carry-forward mechanism, ensuring consistency in position management during risk events. This integration helps prevent false signals while maintaining responsive risk control.
Performance Analysis
The strategy’s effectiveness is evaluated through a comprehensive analysis framework that considers multiple aspects of portfolio performance. Total and annualized returns provide the basic performance metrics, while monthly performance decomposition offers insights into the timing and sources of returns. Cluster contribution analysis helps understand how different groups of assets affect overall performance.
Risk metrics include annualized volatility and maximum drawdown measurements, providing a clear picture of the strategy’s risk profile. The Sharpe and Calmar ratios offer standardized measures of risk-adjusted performance, while market exposure analysis helps understand the strategy’s relationship with broader market movements.
Trading efficiency is monitored through transaction frequency analysis and market participation rate measurements. These metrics, combined with careful tracking of implicit rebalancing costs, help optimize the strategy’s implementation and maintain its effectiveness over time.
Elaborated with Python
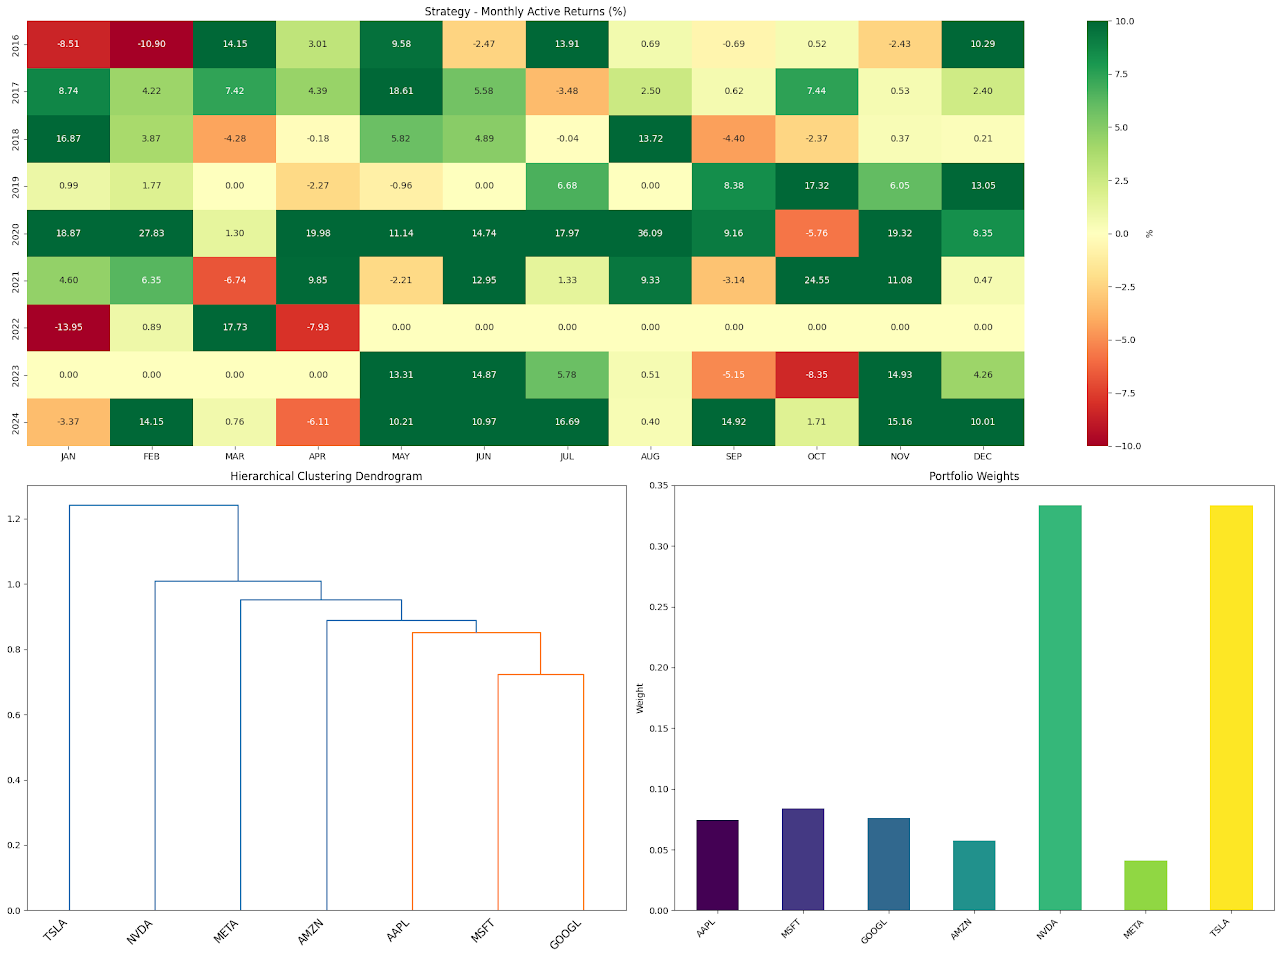
Portfolio Weights:
AAPL: 7.46%
MSFT: 8.41%
GOOGL: 7.59%
AMZN: 5.76%
NVDA: 33.33%
META: 4.12%
TSLA: 33.33%
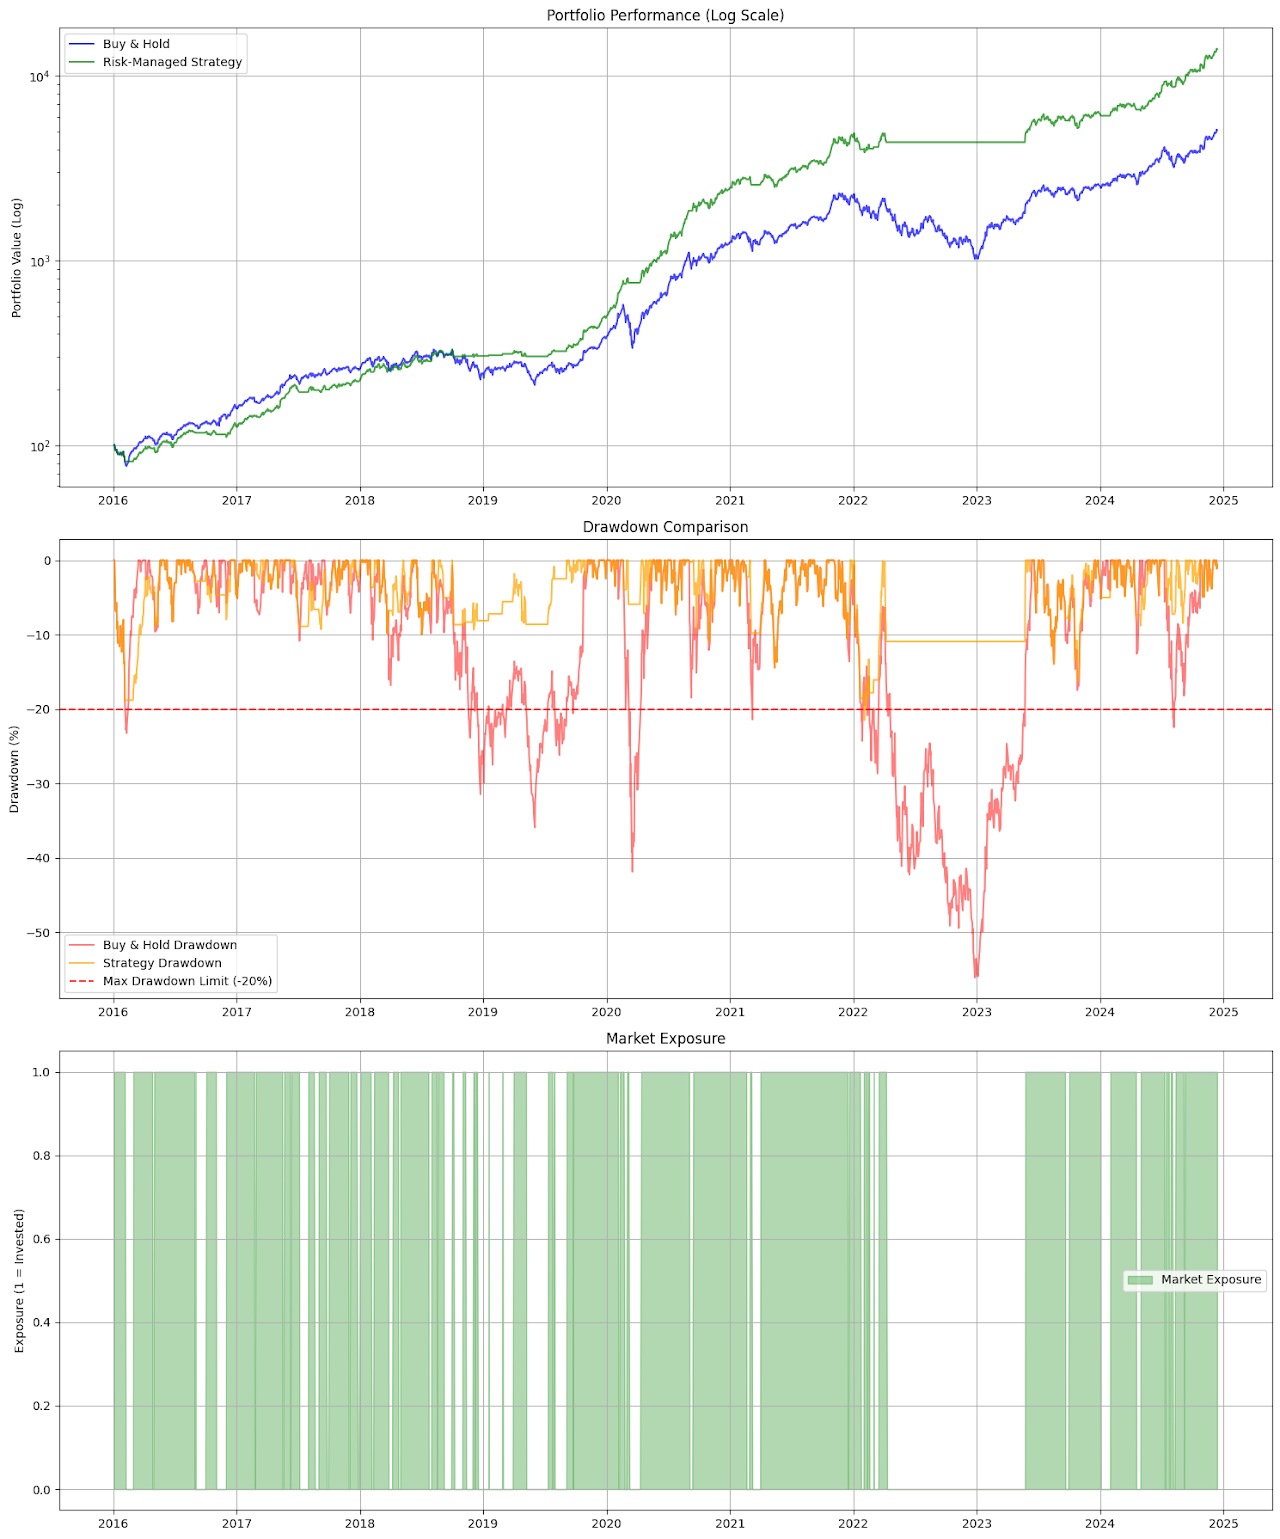
=== Backtest Results (2016-2025) ===
Buy & Hold:
Total Return: 4966.85%
Annualised Return: 54.47%
Annualised Volatility: 36.59%
Sharpe Ratio: 1.49
Drawdown: -56.07%
Calmar Ratio: 0.97
Risk Management Strategy:
Total Return: 13396.63%
Annualised Return: 72.17%
Annualised Volatility: 24.61%
Sharpe Ratio: 2.93
Drawdown: -21.48%
Calmar Ratio: 3.36
Active days: 67.3%
Number of Trades: 49Potential Enhancements
While the current implementation provides a robust framework for portfolio management, several promising areas for enhancement could further improve its effectiveness. Machine learning techniques could be integrated to optimize cluster numbers dynamically and incorporate predictive analytics for risk signals. This could be particularly valuable in adapting to changing market conditions.
The risk management framework could be enhanced by incorporating Conditional Value at Risk (CVaR) and implementing regime-dependent risk thresholds. These additions would provide a more nuanced approach to risk management, particularly during extreme market conditions.
The portfolio construction process could benefit from dynamic rebalancing thresholds and transaction cost optimization. These enhancements would help maintain the strategy’s effectiveness while minimizing implementation costs.
Options-based tail risk hedging could add another layer of protection, particularly valuable given the concentrated nature of the portfolio. Additionally, incorporating fundamental factors could provide a more comprehensive approach to asset selection and weighting.
Conclusion
This quantitative approach to managing a concentrated technology portfolio demonstrates the power of combining sophisticated clustering techniques with dynamic risk management. The framework provides a systematic method for capturing the growth potential of leading technology companies while maintaining disciplined risk controls.
The strategy’s modular design allows for continuous improvement and adaptation to changing market conditions. As the technology sector continues to evolve and market dynamics shift, the flexibility to incorporate new enhancements while maintaining the core risk management framework makes this approach particularly valuable for institutional and sophisticated investors.
Looking forward, the integration of advanced machine learning techniques, improved risk modelling, and sophisticated portfolio optimization methods will continue to enhance this framework’s effectiveness, ensuring its relevance in an ever-changing market landscape.
Finally, here is the code: