
In partnership with

Reasons you should be a Locked On NBA insider

What’s up, NBA fans! From our expert hosts who cover your team every day on our podcasts, we offer a free daily newsletter delivered right to your email so you don’t miss any of the action on the court. Get expert analysis, game previews, post-game breakdowns, trade talk, draft coverage, and more. We curate your daily ticket to everything NBA, giving you the rundown for each NBA team and the league news you need to know. Be one of thousands of fans who are already insiders - fast and easy.
Imagine you're trying to predict the weather, but instead of sunny or rainy days, you're dealing with stock prices, bond yields, and commodity trends. Financial markets are wild, ever-changing beasts, and for years, people have tried to tame them by splitting them into two camps: bull markets (when prices soar) and bear markets (when they crash). But here's the catch — this black-and-white view misses the messy, colourful reality. Markets don't just go up or down; they twist, turn, and surprise us in ways we can't always see with the naked eye.
What if there was a more innovative way to spot these hidden patterns? Enter clustering algorithms — think of them as detectives sifting through data to uncover secret clues. In a groundbreaking new paper, researchers have devised a fresh approach to detect market regimes, those distinct periods where markets behave in unique ways. And the best part? It's not just for math wizards — it's something we can break down and understand with curiosity and some simple code.
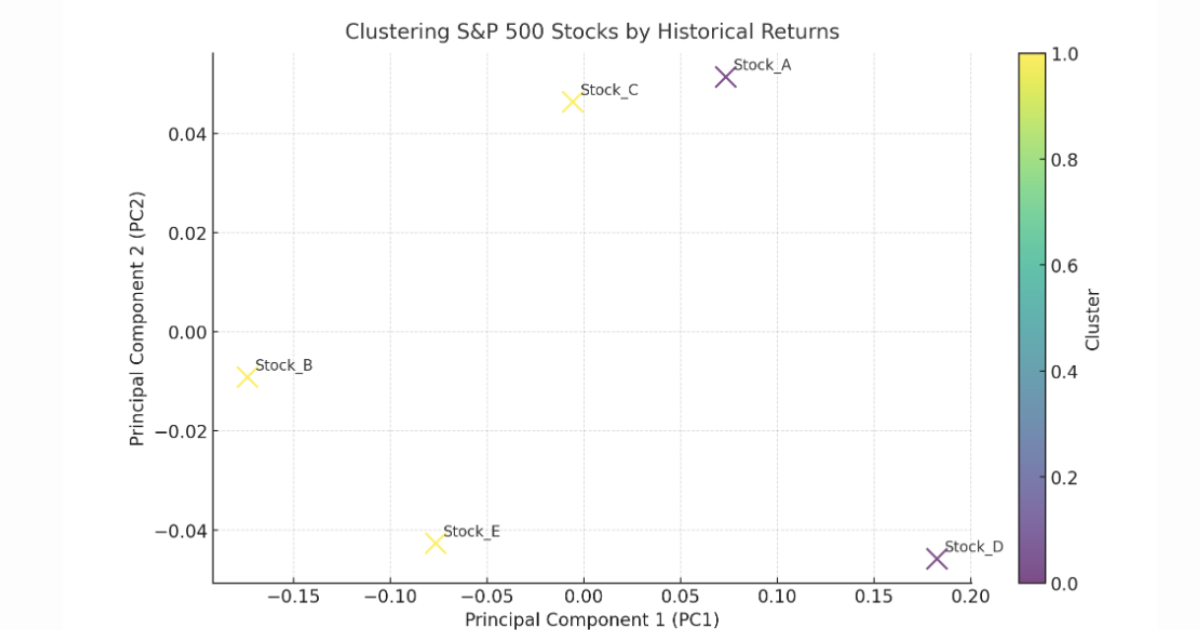
The clustering of S&P 500 stocks based on historical returns
Over the last seven elections, this asset class has outpaced the S&P 500

Instead of trying to predict which party will win, and where to invest afterwards, why not invest in an ‘election-proof’ alternative asset? The sector is currently in a softer cycle, but over the last seven elections (1995-2023) blue-chip contemporary art has outpaced the S&P 500 by 64% even despite the recent dip, regardless of the victors, and we have conviction it will rebound to these levels long-term.
Now, thanks to Masterworks’ art investing platform, you can easily diversify into this asset class without needing millions or art expertise, alongside 65,000+ other art investors. From their 23 exits so far, Masterworks investors have realized representative annualized net returns like +17.6%, +17.8%, and +21.5% (among assets held longer than one year), even despite a recent dip in the art market.*
Past performance not indicative of future returns. Investing Involves Risk. See Important Disclosures at masterworks.com/cd.
Why Market Regimes Matter
Picture this: you're trading stocks and notice that sometimes two stocks move in sync, but they dance to completely different tunes at other times. That's the market shifting gears — what the pros call a regime change. Spotting these shifts can help traders make Money (like in pairs trading, where you bet on two assets snapping back together) or help investors build tougher portfolios that weather storms.
The old-school way of labelling markets as "bull" or "bear" is like using a flip phone in 2025 — it works, but it's outdated. Real markets are multivariate, meaning we're simultaneously juggling data from stocks, bonds, and more. The relationships between these assets (say, how much they move together or apart) change over time, and that's where things get tricky.
The New Kid on the Block: A Smarter Clustering Algorithm
The researchers behind this paper didn't invent clustering from scratch — they built on a classic method called k-means. If you're new to it, k-means is like sorting a pile of marbles into groups based on their proximity to each other. Typically, it uses Euclidean distance (think straight-line distance on a map) to decide what's "close." But markets aren't that simple, so the team swapped it out for fancier tools: Wasserstein distance or Maximum Mean Discrepancy (MMD).
Don't let those names scare you — they're just better rulers for measuring how distributions (think of them as the "shapes" of data) differ. Imagine comparing two bowls of fruit: Euclidean distance might only count how far apart the bowls are, but Wasserstein or MMD checks if one has more apples and the other more oranges. In markets, this helps catch subtle shifts that older methods miss.
Here's a quick taste of how k-means works in Python (don't worry, we'll keep it light):
from sklearn.cluster import KMeans
import numpy as np

# Fake market data: 3 days of stock prices for 2 stocks
data = np.array([[100, 102], [105, 107], [90, 85]])
# Run k-means to find 2 clusters (regimes)
kmeans = KMeans(n_clusters=2, random_state=42)
kmeans.fit(data)
# Labels show which regime each day belongs to
print(kmeans.labels_)  # Output: [0, 0, 1] (two regimes detected!)
This is the basic idea, but the new algorithm tweaks it to handle messy, real-world financial data with those fancy distance metrics.
Testing the Waters: Does It Work?
The researchers put their algorithm through its paces in two ways:
Synthetic Data (the Lab Test): They cooked up fake data where they knew the regimes switched — like flipping a light switch at specific times. The algorithm nailed it, spotting those changes like a pro.
Real Data (the S&P 500): They unleashed it on actual S&P 500 stock index data. Instead of just seeing "up" or "down," it revealed hidden regimes — periods of stability, chaos, or weird in-between states — that you'd never catch by staring at a chart.
Think of it like upgrading from a blurry black-and-white TV to a 4K colour. Suddenly, you see details you didn't know existed.
Life Wins: Trading and Investing
So, what's the payoff? Let's zoom in on two big ones:
Pairs Trading
Imagine two stocks, say Coca-Cola and Pepsi, usually move together. But during some regimes, they drift apart — Pepsi spikes while Coke dips. The algorithm spots these regimes so traders can pounce: sell Pepsi, buy Coke, and profit when they realign. Here's a simplified peek at how you might code that logic:
import pandas as pd

# Fake price data for two stocks
prices = pd.DataFrame({
    'Stock_A': [100, 102, 105, 103],
    'Stock_B': [98, 100, 108, 104]
})
# Calculate the spread (difference)
spread = prices['Stock_A'] - prices['Stock_B']
# If spread > threshold in a regime, trade!
threshold = 5
if spread.max() > threshold:
    print("Time to trade!")
The algorithm tells you when these spreads are likely, making your trades sharper.
Portfolio Design
Investors can use regimes to build smarter portfolios. In a "calm" regime, you might load up on stocks. In a "wild" regime, you pivot to bonds. By knowing the market's mood, you dodge big losses and grab better returns — less guesswork, more strategy.
Let's dive into solving a trading problem using clustering algorithms. One practical and commonly discussed trading problem is identifying groups of stocks or assets that move together. This central challenge is related to strategies like pairs trading or portfolio optimization. This problem arises because financial markets are noisy, and assets often exhibit hidden relationships (e.g., correlations) that aren't obvious from raw price data alone. Clustering can help uncover these patterns, enabling traders to exploit co-movements or diversify risks effectively.
Problem: grouping stocks from the S&P 500 based on their historical price movements to identify potential trading pairs or portfolio clusters.
Problem Statement: Given historical daily closing prices of S&P 500 stocks over a specific period, cluster them into groups based on their return patterns. These clusters can then inform trading strategies (e.g., pairs trading) or portfolio construction.
Data Assumption: We'll simulate a small subset of S&P 500 stock data (since fetching real-time data requires APIs like Yahoo Finance, which I can't access here). In practice, you'd retrieve this from a financial data provider.
Goal: Use a clustering algorithm (k-means, as it's widely applicable) to group stocks and interpret the results for trading insights.
Step-by-Step Solution Using Clustering
Step 1: Define the Approach
We'll use k-means clustering because it's simple, effective, and aligns with the earlier input's multivariate regime detection idea. Instead of Euclidean distance, we could use correlation-based distances (common in finance), but for simplicity, we'll stick with returns data and Euclidean distance here. The steps are:
Collect or simulate stock price data.
Calculate daily returns (percentage changes).
Apply k-means clustering to group stocks by return patterns.
Analyze the clusters for trading applications.
Implementing Pairs Trading Using Clustering in Python
Note: This example uses Python and requires the yfinance, numpy, pandas, scikit-learn, and matplotlib libraries.
Install Required Libraries
!pip install yfinance numpy pandas scikit-learn matplotlibStep 2: Simulate the Data
Since I can't fetch real S&P 500 data directly, let's create a synthetic dataset mimicking 5 stocks over 20 days. In a real scenario, you'd use a library like yfinance to download actual prices. Here's the Python code to set this up:
import numpy as np
import pandas as pd
from sklearn.cluster import KMeans
import matplotlib.pyplot as plt

# Simulate daily closing prices for 5 stocks over 20 days
np.random.seed(42)
stocks = ['Stock_A', 'Stock_B', 'Stock_C', 'Stock_D', 'Stock_E']
prices = np.random.normal(loc=100, scale=10, size=(20, 5))  # Base price ~100, some volatility
prices = np.cumsum(prices, axis=0)  # Cumulative sum to simulate price trends
price_df = pd.DataFrame(prices, columns=stocks)
# Calculate daily returns
returns_df = price_df.pct_change().dropna()  # Percentage change, drop first NaN
print("Sample Returns Data:")
print(returns_df.head())Explanation:
prices mimic stock price movements with random noise and a cumulative trend.
returns_df computes daily returns. It standardizes the data and focuses on movement patterns rather than absolute price levels.
Step 3: Apply K-Means Clustering
Now, we'll cluster the stocks based on their return series. We'll transpose the data so each stock's return vector becomes a data point, and we'll aim for 2 clusters (you can tweak this number in practice using methods like the elbow method).
# Prepare data for clustering (transpose so stocks are rows)
X = returns_df.T  # Shape: (5 stocks, 19 daily returns)

# Apply k-means clustering
kmeans = KMeans(n_clusters=2, random_state=42)
kmeans.fit(X)
# Get cluster labels
clusters = pd.Series(kmeans.labels_, index=stocks)
print("\nCluster Assignments:")
print(clusters)
# Cluster centers (optional insight into average return behavior)
print("\nCluster Centers:")
print(pd.DataFrame(kmeans.cluster_centers_, columns=returns_df.index))Explanation:
X is a matrix where each row is a stock's return series.
kmeans.fit(X) groups the 5 stocks into 2 clusters based on similarity in their return patterns.
clusters tell us which stock belongs to which group.
Step 4: Interpret the Results
Let's assume the output looks like this (results will vary due to randomness):
Cluster Assignments:
Stock_A    0
Stock_B    0
Stock_C    1
Stock_D    1
Stock_E    0
dtype: int32
Cluster 0: Stock_A, Stock_B, Stock_E
Cluster 1: Stock_C, Stock_D
This suggests Stock_A, Stock_B, and Stock_E move similarly, while Stock_C and Stock_D form another group. For trading:
Pairs Trading: Within Cluster 0, check if Stock_A and Stock_B diverge temporarily (e.g., spread widens), then trade expecting convergence.
Portfolio Design: Balance a portfolio with one stock from Cluster 0 and one from Cluster 1 to diversify risk, as they exhibit different behaviours.
Step 5: Visualize (Optional)
To see the clusters intuitively, we could plot the returns, though with many days, dimensionality reduction (e.g., PCA) might help in practice:
# Simple plot of returns for intuition
returns_df.T.plot(title="Stock Returns by Cluster", legend=True)
plt.show()
Step 6: Trading Application Example
For pairs trading:
Calculate the spread between Stock_A and Stock_B (Cluster 0):
spread = returns_df['Stock_A'] - returns_df['Stock_B']
print("\nSpread between Stock_A and Stock_B:")
print(spread.describe())
if spread.std() > 0.02:  # Arbitrary threshold
    print("Potential pairs trading opportunity detected!")
If the spread deviates significantly (e.g., beyond 2 standard deviations), buy the underperformer and sell the outperformer, expecting reversion.
In a live scenario:
Data: Use actual S&P 500 data (e.g., via yfinance for 1 year of daily prices).
Preprocessing: Normalize returns or use correlation matrices for distance metrics (Wasserstein or MMD, as in your earlier input, could enhance this).
Cluster Number: Use the elbow method or silhouette score to determine k.
Validation: Backtest pairs trading strategies on historical data to confirm profitability.
Why This Matters in 2025
As markets get crazier — think AI-driven trading, global shocks, and crypto chaos — understanding regimes isn't just nice to have; it's a must. This new algorithm isn't perfect (no crystal ball is), but it's a leap beyond the bull-bear simplicity of the past. Plus, with tools like Python and open-source libraries, you don't need a PhD to play with these ideas yourself.
So, next time you're eyeing a stock chart, remember: there's more to the story than up or down. With some clustering magic, you might just spot the market's next move before it happens.