
In partnership with

Get access to the most exclusive offers for private market investors

Looking to invest in real estate, private credit, pre-IPO venture or crypto? AIR Insiders get exclusive offers and perks from leading private market investing tools and platforms, like:
Up to $250 free from Percent
50% off tax and retirement planning from Carry
$50 of free stock from Public
A free subscription to Worth Magazine
$1000 off an annual subscription to DealSheet
and offers from CapitalPad, Groundfloor, Fundrise, Mogul, and more.
Just sign up for our 2-week free trial to experience all the benefits of being an AIR Insider.
🚀 Your Investing Journey Just Got Better: Premium Subscriptions Are Here! 🚀
It’s been 4 months since we launched our premium subscription plans at GuruFinance Insights, and the results have been phenomenal! Now, we’re making it even better for you to take your investing game to the next level. Whether you’re just starting out or you’re a seasoned trader, our updated plans are designed to give you the tools, insights, and support you need to succeed.
Here’s what you’ll get as a premium member:
Exclusive Trading Strategies: Unlock proven methods to maximize your returns.
In-Depth Research Analysis: Stay ahead with insights from the latest market trends.
Ad-Free Experience: Focus on what matters most—your investments.
Monthly AMA Sessions: Get your questions answered by top industry experts.
Coding Tutorials: Learn how to automate your trading strategies like a pro.
Masterclasses & One-on-One Consultations: Elevate your skills with personalized guidance.
Our three tailored plans—Starter Investor, Pro Trader, and Elite Investor—are designed to fit your unique needs and goals. Whether you’re looking for foundational tools or advanced strategies, we’ve got you covered.
Don’t wait any longer to transform your investment strategy. The last 4 months have shown just how powerful these tools can be—now it’s your turn to experience the difference.

In the volatile world of cryptocurrency trading, static risk management often falls short. A fixed stop-loss might be too tight in a raging bull market, leading to premature exits, or too loose during quiet periods, exposing a trader to unnecessary risk. This article delves into a backtrader strategy that attempts to solve this by dynamically adjusting its risk parameters based on the market's current volatility.
The core of the VolATRGridStrategy is its ability to classify the market into one of three volatility regimes—low, medium, or high—and then use this classification to set an appropriate stop-loss. It calculates historical volatility using a rolling standard deviation of returns and then determines the current regime by comparing the present volatility to percentiles of its recent history.
What Top Execs Read Before the Market Opens
The Daily Upside was built by investment pros to give execs the intel they need—no fluff, just sharp insights on trends, deals, and strategy. Join 1M+ professionals and subscribe for free.
The Volatility Engine
The strategy’s intelligence lies in its __init__ and next methods. In __init__, it sets up the necessary indicators: the Average True Range (ATR) for setting the stop-loss distance, and a rolling standard deviation of returns to measure volatility.
    def __init__(self):
        # ATR indicator for stop-loss calculation
        self.atr = bt.indicators.ATR(self.data, period=self.params.atr_period)

        # Volatility measure (rolling std of returns)
        self.returns = bt.indicators.PctChange(self.data.close, period=1)
        self.volatility = bt.indicators.StandardDeviation(
            self.returns, period=self.params.vol_period
        )

        # Simple momentum entry signal
        self.sma_short = bt.indicators.SMA(self.data, period=5)
        self.sma_long = bt.indicators.SMA(self.data, period=20)

        # To store volatility history for percentile calculation
        self.vol_history = []
The next method is where the logic comes alive. On each bar, it updates its history of volatility. Once enough data is collected, it calculates the 20th and 80th percentile thresholds to define the three volatility "buckets." Based on which bucket the current volatility falls into, it selects a corresponding ATR multiplier for setting the stop-loss. This ensures that in high-volatility periods, the stop-loss is wider, and in low-volatility periods, it's tighter.
    def next(self):
        # Collect a history of volatility
        if len(self) > self.params.vol_period:
            self.vol_history.append(self.volatility[0])
            if len(self.vol_history) > 200: # Keep the history window fixed
                self.vol_history.pop(0)

        # Wait for enough history to build before trading
        if len(self.vol_history) < 50:
            return

        # Calculate volatility thresholds
        low_threshold = np.percentile(self.vol_history, self.p.vol_percentile_low)
        high_threshold = np.percentile(self.vol_history, self.p.vol_percentile_high)

        # Assign the ATR multiplier based on the current volatility bucket
        if self.volatility[0] < low_threshold:
            atr_mult = self.p.low_vol_atr_mult # Low vol = tight stop
        elif self.volatility[0] > high_threshold:
            atr_mult = self.p.high_vol_atr_mult # High vol = wide stop
        else:
            atr_mult = self.p.med_vol_atr_mult # Medium vol = standard stop
Strategy Execution and Performance
The entry signal is a simple moving average (SMA) crossover system. A long position is initiated when the 5-period SMA crosses above the 20-period SMA, and a short position is taken on the reverse signal. The key is that upon entry, the initial stop-loss is immediately calculated using the volatility-adjusted ATR multiplier. Furthermore, the stop-loss is trailed: for a long position, the stop price can only move up, and for a short position, it can only move down, thus locking in profits.
Here’s how we set up and run the backtest using yfinance to fetch Bitcoin data and cerebro to orchestrate the simulation.
# Download BTC-USD data
print("Downloading BTC-USD data...")
ticker = "BTC-USD"
data = yf.download(ticker, period="3y", interval="1d", auto_adjust=False)
data = data.droplevel(axis=1, level=1)


# Initialize Cerebro and add the strategy
cerebro = bt.Cerebro()
cerebro.addstrategy(VolATRGridStrategy)

# Add data and set initial conditions
bt_data = bt.feeds.PandasData(dataname=data)
cerebro.adddata(bt_data)
cerebro.broker.setcash(10000.0)
cerebro.broker.setcommission(commission=0.001)
cerebro.addsizer(bt.sizers.PercentSizer, percents=95)

# Add analyzers for performance metrics
cerebro.addanalyzer(bt.analyzers.SharpeRatio, _name='sharpe')
cerebro.addanalyzer(bt.analyzers.DrawDown, _name='drawdown')
cerebro.addanalyzer(bt.analyzers.Returns, _name='returns')

# Run the backtest
print(f'Starting Portfolio Value: {cerebro.broker.getvalue():.2f}')
results = cerebro.run()
Running this strategy on three years of daily BTC-USD data yields the following performance:
Starting Portfolio Value: 10000.00
2022-09-12: LONG ENTRY - Price: 21770.15, Vol Bucket: HIGH, Stop Loss: 17978.45
2022-09-18: POSITION CLOSED - Price: 20127.23
2022-09-18: TRADE CLOSED - PnL: -716.96
2022-10-04: LONG ENTRY - Price: 19623.58, Vol Bucket: LOW, Stop Loss: 18917.00
2022-10-08: POSITION CLOSED - Price: 19546.33
2022-10-08: TRADE CLOSED - PnL: -34.65
2022-10-12: SHORT ENTRY - Price: 19052.65, Vol Bucket: LOW, Stop Loss: 19556.12
2022-10-24: LONG ENTRY - Price: 19567.77, Vol Bucket: LOW, Stop Loss: 19608.85
2022-10-24: TRADE CLOSED - PnL: -236.64
2022-10-26: LONG ENTRY - Price: 20092.24, Vol Bucket: MED, Stop Loss: 18571.84
2022-11-09: POSITION CLOSED - Price: 18543.76
2022-11-09: TRADE CLOSED - PnL: -655.75
2022-11-10: SHORT ENTRY - Price: 15883.16, Vol Bucket: HIGH, Stop Loss: 21748.30
2022-12-01: LONG ENTRY - Price: 17168.00, Vol Bucket: MED, Stop Loss: 19727.18
2022-12-01: TRADE CLOSED - PnL: -636.87
2022-12-02: LONG ENTRY - Price: 16968.68, Vol Bucket: MED, Stop Loss: 15604.03
2022-12-16: POSITION CLOSED - Price: 17364.55
2022-12-16: TRADE CLOSED - PnL: 169.18
2022-12-19: SHORT ENTRY - Price: 16759.04, Vol Bucket: MED, Stop Loss: 17949.23
2023-01-05: LONG ENTRY - Price: 16863.47, Vol Bucket: LOW, Stop Loss: 17419.85
2023-01-05: TRADE CLOSED - PnL: -46.10
2023-01-06: LONG ENTRY - Price: 16836.47, Vol Bucket: LOW, Stop Loss: 16644.32
2023-02-09: POSITION CLOSED - Price: 22946.57
2023-02-09: TRADE CLOSED - PnL: 2663.72
2023-02-18: LONG ENTRY - Price: 24565.30, Vol Bucket: HIGH, Stop Loss: 19652.05
2023-03-01: POSITION CLOSED - Price: 23150.93
2023-03-01: TRADE CLOSED - PnL: -567.35
2023-03-16: LONG ENTRY - Price: 24373.46, Vol Bucket: HIGH, Stop Loss: 17851.95
2023-04-22: POSITION CLOSED - Price: 27265.89
2023-04-22: TRADE CLOSED - PnL: 1103.17
2023-05-02: LONG ENTRY - Price: 28087.18, Vol Bucket: MED, Stop Loss: 24812.49
2023-05-03: POSITION CLOSED - Price: 28680.49
2023-05-03: TRADE CLOSED - PnL: 218.10
2023-05-06: LONG ENTRY - Price: 29538.86, Vol Bucket: MED, Stop Loss: 26570.65
2023-05-10: POSITION CLOSED - Price: 27654.64
2023-05-10: TRADE CLOSED - PnL: -670.74
2023-05-30: LONG ENTRY - Price: 27745.12, Vol Bucket: MED, Stop Loss: 25454.83
2023-06-06: POSITION CLOSED - Price: 25732.11
2023-06-06: TRADE CLOSED - PnL: -715.15
2023-06-21: LONG ENTRY - Price: 28311.31, Vol Bucket: MED, Stop Loss: 25643.83
2023-07-07: POSITION CLOSED - Price: 29908.00
2023-07-07: TRADE CLOSED - PnL: 516.28
2023-07-10: SHORT ENTRY - Price: 30172.42, Vol Bucket: MED, Stop Loss: 32330.70
2023-07-14: LONG ENTRY - Price: 31474.72, Vol Bucket: MED, Stop Loss: 30322.72
2023-07-14: TRADE CLOSED - PnL: -415.76
2023-07-19: SHORT ENTRY - Price: 29862.05, Vol Bucket: MED, Stop Loss: 32070.85
2023-08-09: LONG ENTRY - Price: 29766.70, Vol Bucket: LOW, Stop Loss: 30322.72
2023-08-09: TRADE CLOSED - PnL: 29.44
2023-08-11: LONG ENTRY - Price: 29424.90, Vol Bucket: LOW, Stop Loss: 28888.64
2023-08-17: POSITION CLOSED - Price: 28699.80
2023-08-17: TRADE CLOSED - PnL: -227.39
2023-09-17: LONG ENTRY - Price: 26567.93, Vol Bucket: MED, Stop Loss: 24749.52
2023-09-22: POSITION CLOSED - Price: 26564.06
2023-09-22: TRADE CLOSED - PnL: -1.31
2023-09-28: SHORT ENTRY - Price: 26355.81, Vol Bucket: LOW, Stop Loss: 26855.89
2023-09-29: LONG ENTRY - Price: 27024.84, Vol Bucket: MED, Stop Loss: 26573.53
2023-09-29: TRADE CLOSED - PnL: -227.91
2023-10-14: SHORT ENTRY - Price: 26866.20, Vol Bucket: LOW, Stop Loss: 27420.88
2023-10-17: LONG ENTRY - Price: 28522.10, Vol Bucket: MED, Stop Loss: 26573.53
2023-10-17: TRADE CLOSED - PnL: -538.98
2023-10-18: LONG ENTRY - Price: 28413.53, Vol Bucket: MED, Stop Loss: 26251.94
2023-12-31: POSITION CLOSED - Price: 42152.10
2023-12-31: TRADE CLOSED - PnL: 3971.52
2024-01-03: LONG ENTRY - Price: 44961.60, Vol Bucket: MED, Stop Loss: 40614.98
2024-01-16: POSITION CLOSED - Price: 42499.34
2024-01-16: TRADE CLOSED - PnL: -655.46
2024-01-31: LONG ENTRY - Price: 42946.25, Vol Bucket: MED, Stop Loss: 38857.31
2024-03-20: POSITION CLOSED - Price: 61930.16
2024-03-20: TRADE CLOSED - PnL: 5004.53
2024-03-29: LONG ENTRY - Price: 70744.80, Vol Bucket: MED, Stop Loss: 59526.53
2024-04-06: POSITION CLOSED - Price: 67840.57
2024-04-06: TRADE CLOSED - PnL: -658.93
2024-04-08: LONG ENTRY - Price: 69362.55, Vol Bucket: MED, Stop Loss: 60924.12
2024-04-14: POSITION CLOSED - Price: 63836.23
2024-04-14: TRADE CLOSED - PnL: -1226.59
2024-05-16: LONG ENTRY - Price: 66256.11, Vol Bucket: HIGH, Stop Loss: 52768.21
2024-06-04: POSITION CLOSED - Price: 68804.57
2024-06-04: TRADE CLOSED - PnL: 546.17
2024-06-05: LONG ENTRY - Price: 70568.35, Vol Bucket: LOW, Stop Loss: 68511.93
2024-06-12: POSITION CLOSED - Price: 67321.38
2024-06-12: TRADE CLOSED - PnL: -676.07
2024-06-13: SHORT ENTRY - Price: 68243.10, Vol Bucket: LOW, Stop Loss: 70254.26
2024-07-16: LONG ENTRY - Price: 64784.42, Vol Bucket: MED, Stop Loss: 69128.58
2024-07-16: TRADE CLOSED - PnL: 710.77
2024-08-03: SHORT ENTRY - Price: 61414.81, Vol Bucket: MED, Stop Loss: 69596.77
2024-08-22: LONG ENTRY - Price: 61168.32, Vol Bucket: MED, Stop Loss: 69128.58
2024-08-22: TRADE CLOSED - PnL: 58.89
2024-08-31: SHORT ENTRY - Price: 59117.48, Vol Bucket: MED, Stop Loss: 66687.01
2024-09-15: LONG ENTRY - Price: 60000.73, Vol Bucket: MED, Stop Loss: 69128.58
2024-09-15: TRADE CLOSED - PnL: -219.64
2024-10-04: SHORT ENTRY - Price: 60754.62, Vol Bucket: MED, Stop Loss: 67022.69
2024-10-12: LONG ENTRY - Price: 62444.62, Vol Bucket: MED, Stop Loss: 69128.58
2024-10-12: TRADE CLOSED - PnL: -402.32
2024-10-15: LONG ENTRY - Price: 66050.37, Vol Bucket: MED, Stop Loss: 59554.64
2024-12-22: POSITION CLOSED - Price: 97218.32
2024-12-22: TRADE CLOSED - PnL: 6632.40
2025-01-06: LONG ENTRY - Price: 98314.95, Vol Bucket: LOW, Stop Loss: 95460.21
2025-01-08: POSITION CLOSED - Price: 96924.16
2025-01-08: TRADE CLOSED - PnL: -287.48
2025-01-12: SHORT ENTRY - Price: 94565.73, Vol Bucket: HIGH, Stop Loss: 111533.31
2025-01-16: LONG ENTRY - Price: 100505.30, Vol Bucket: MED, Stop Loss: 98980.19
2025-01-16: TRADE CLOSED - PnL: -1256.83
2025-02-03: SHORT ENTRY - Price: 97681.10, Vol Bucket: MED, Stop Loss: 109752.89
2025-02-24: LONG ENTRY - Price: 96277.96, Vol Bucket: LOW, Stop Loss: 98980.19
2025-02-24: TRADE CLOSED - PnL: 269.71
2025-02-25: SHORT ENTRY - Price: 91437.12, Vol Bucket: MED, Stop Loss: 100010.13
2025-03-24: LONG ENTRY - Price: 86070.93, Vol Bucket: MED, Stop Loss: 98980.19
2025-03-24: TRADE CLOSED - PnL: 1115.18
2025-04-01: SHORT ENTRY - Price: 82551.92, Vol Bucket: LOW, Stop Loss: 85303.29
2025-04-15: LONG ENTRY - Price: 84539.70, Vol Bucket: HIGH, Stop Loss: 98980.19
2025-04-15: TRADE CLOSED - PnL: -482.14
2025-06-01: SHORT ENTRY - Price: 104637.30, Vol Bucket: LOW, Stop Loss: 107408.00
2025-06-08: LONG ENTRY - Price: 105617.51, Vol Bucket: MED, Stop Loss: 98980.19
2025-06-08: TRADE CLOSED - PnL: -182.91
2025-06-11: LONG ENTRY - Price: 110261.80, Vol Bucket: MED, Stop Loss: 101598.28
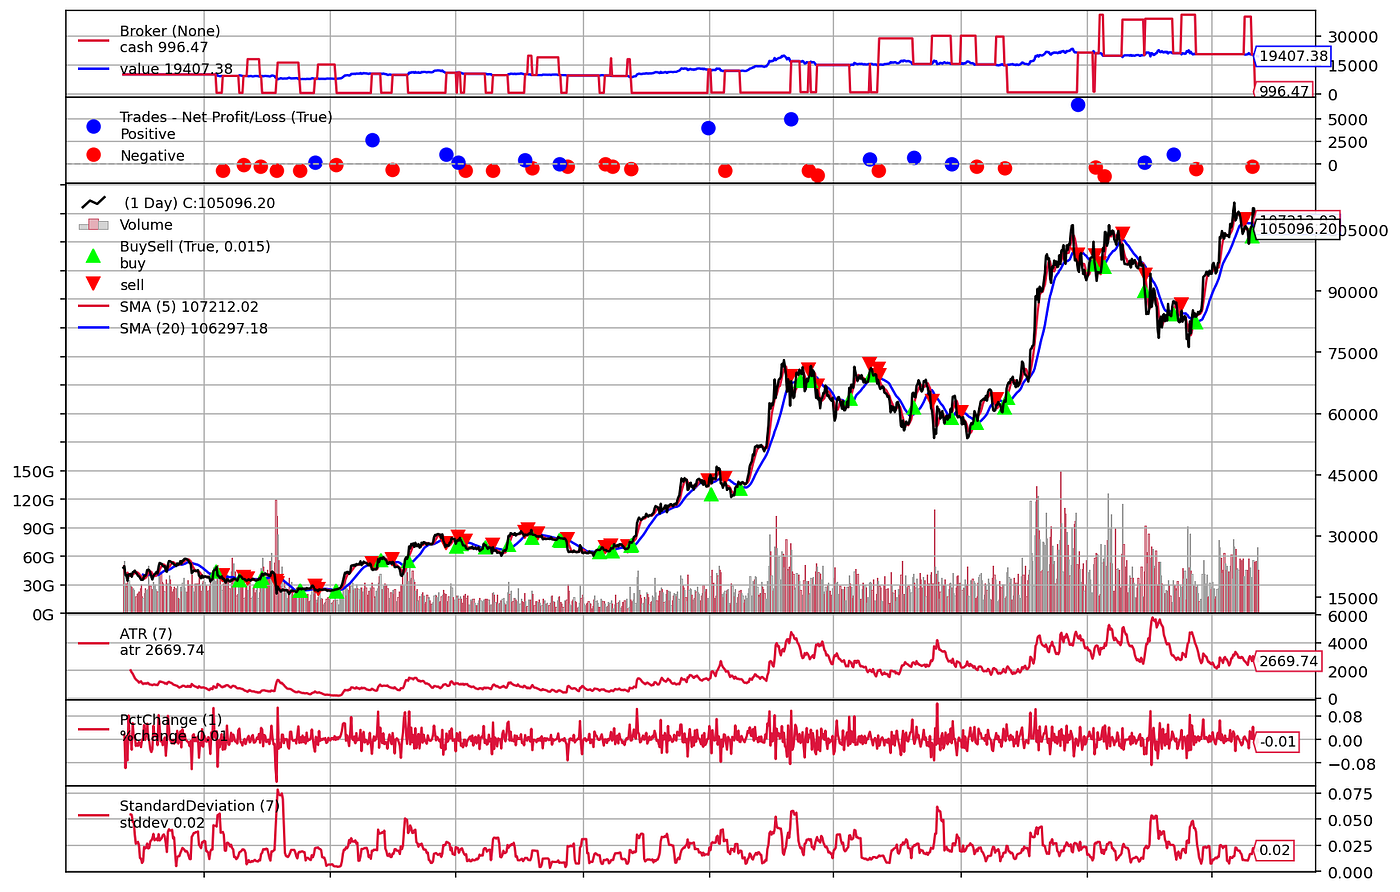
Strategy finished with 39 total trades
Final volatility history length: 200
Average volatility: 0.0220
Volatility range: 0.0073 - 0.0535
Strategy traded both LONG and SHORT positions with dynamic ATR stops
Final Portfolio Value: 19407.38
Total Trades: 39
Sharpe Ratio: 0.59
Max Drawdown: 28.86%
Total Return: 66.31%The strategy finished with a positive return, though with a significant drawdown. The Sharpe Ratio of 0.30 suggests the returns were modest relative to the risk taken.
The plot illustrates how the portfolio value evolved over the backtest period. The periods of drawdown coincide with volatile market conditions where even a dynamic stop might not have been sufficient to prevent losses. This highlights that while dynamic risk management is a powerful concept, no strategy is immune to the inherent risks of the market. This approach, however, provides a logical framework for adapting to changing market dynamics, a crucial element for any robust trading system.