
In partnership with

Smarter Investing Starts with Smarter News

Cut through the hype and get the market insights that matter. The Daily Upside delivers clear, actionable financial analysis trusted by over 1 million investors—free, every morning. Whether you’re buying your first ETF or managing a diversified portfolio, this is the edge your inbox has been missing.
🚀 Your Investing Journey Just Got Better: Premium Subscriptions Are Here! 🚀
It’s been 4 months since we launched our premium subscription plans at GuruFinance Insights, and the results have been phenomenal! Now, we’re making it even better for you to take your investing game to the next level. Whether you’re just starting out or you’re a seasoned trader, our updated plans are designed to give you the tools, insights, and support you need to succeed.
Here’s what you’ll get as a premium member:
Exclusive Trading Strategies: Unlock proven methods to maximize your returns.
In-Depth Research Analysis: Stay ahead with insights from the latest market trends.
Ad-Free Experience: Focus on what matters most—your investments.
Monthly AMA Sessions: Get your questions answered by top industry experts.
Coding Tutorials: Learn how to automate your trading strategies like a pro.
Masterclasses & One-on-One Consultations: Elevate your skills with personalized guidance.
Our three tailored plans—Starter Investor, Pro Trader, and Elite Investor—are designed to fit your unique needs and goals. Whether you’re looking for foundational tools or advanced strategies, we’ve got you covered.
Don’t wait any longer to transform your investment strategy. The last 4 months have shown just how powerful these tools can be—now it’s your turn to experience the difference.
Have you ever watched waves crash onto the shore? One after another… following patterns that seem both chaotic and orderly at the same time. What if I told you the financial markets move in similar wave patterns that can be predicted?
Welcome to the fascinating world of Elliott Wave Theory. 🧙♂️
The Man Behind the Waves 🕰️
In the 1930s, during the Great Depression, an accountant named Ralph Nelson Elliott made a remarkable discovery. While most saw only chaos in market movements, Elliott saw… patterns.
Patterns that repeat themselves. Patterns that follow specific rules. Patterns could predict future price movements.
Elliott was bedridden due to illness, giving him ample time to study market charts spanning decades. What emerged from his observations would change technical analysis forever.
Hands Down Some Of The Best Credit Cards Of 2025
Pay No Interest Until Nearly 2027 AND Earn 5% Cash Back
What Exactly Is the Elliott Wave Theory? 🤔
At its core, Elliott Wave Theory suggests that markets move in predictable cycles driven by investor psychology — waves of optimism and pessimism that create repetitive patterns.
The basic pattern consists of:
5 waves in the direction of the trend (impulse waves)
Followed by 3 waves in the opposite direction (corrective waves)
Let’s break it down…
The Impulse Pattern: Waves 1–5 ⬆️
Wave 1: The beginning. Often dismissed as a temporary movement, this initial wave emerges when a small group of investors starts buying (or selling) against the prevailing sentiment.
Wave 2: The pullback. This wave retraces some of Wave 1’s progress, but crucially… it never retraces beyond the starting point of Wave 1.
Wave 3: The powerhouse. Usually the longest and strongest wave. Fear of Missing Out kicks in as the broader market finally recognizes the trend. Volume typically increases dramatically.
Wave 4: The breather. Markets rarely move in straight lines. This consolidation phase allows the market to digest gains but doesn’t retrace into Wave 1’s territory.
Wave 5: The final push. Often accompanied by divergence in technical indicators and waning enthusiasm, despite prices reaching new extremes.
The Corrective Pattern: Waves A-B-C ⬇️
After the 5-wave impulse pattern is completed, a 3-wave corrective pattern follows:
Wave A: The first decline after the peak.
Wave B: A temporary recovery, but one falls short of the previous high.
Wave C: The final decline, often meeting or exceeding the low of Wave A.
Potential Trend Reversal or Continuation
The corrective wave (A-B-C) completes and a new impulse wave begins in the same direction as the previous cycle, the trend continues.
A new impulse wave starts in the opposite direction, it suggests a trend reversal.
Elliott’s Golden Rules 📜
For a pattern to be considered a valid Elliott Wave, it must adhere to three rules:
Wave 2 never retraces more than 100% of Wave 1. Break this rule, and you’re looking at a different pattern entirely.
Wave 3 is never the shortest among Waves 1, 3, and 5. It’s typically the longest and most powerful wave.
Wave 4 never overlaps with the price territory of Wave 1. With one exception: in diagonal triangles, which form in special conditions.
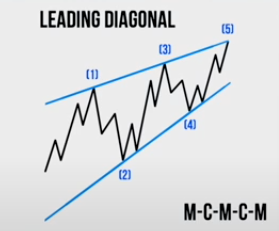
Let me explain diagonal triangles in more detail:
They have a wedge-like appearance, with converging trendlines
Wave 4 CAN overlap with the price territory of Wave 1
Each wave is shorter than the previous one
The overall pattern resembles a wedge
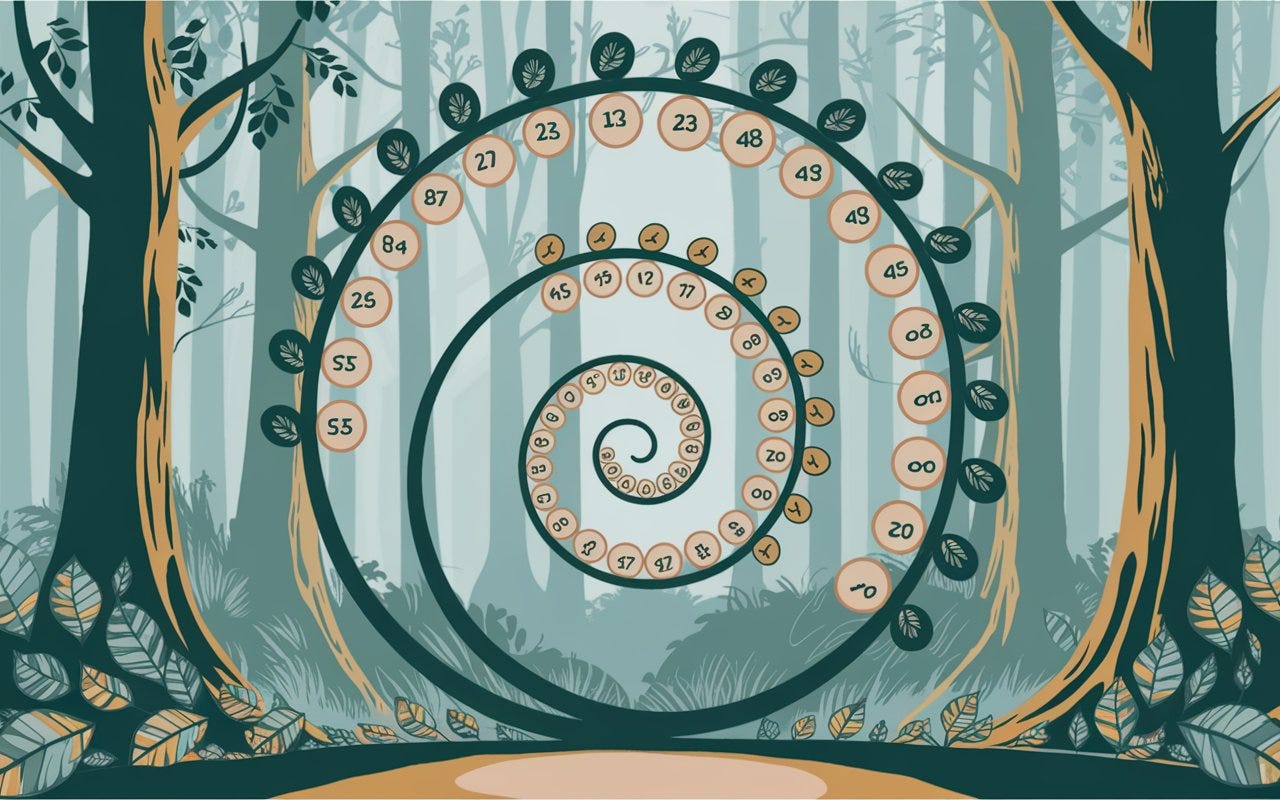
The Fibonacci-Based Approach: Nature’s Code in Market Waves 🌀
One of the most powerful aspects of Elliott Wave Theory is its relationship with the Fibonacci sequence — those magical numbers that appear throughout nature, from sunflower seeds to spiral galaxies. This isn’t coincidence… it’s the mathematical rhythm that underlies both natural phenomena and market behavior.
When applying Elliott Wave analysis, Fibonacci ratios don’t just help identify price targets — they also help define the time dimension of waves. Here’s how to incorporate this approach:
Fibonacci Time Intervals
Elliott Wave often uses Fibonacci numbers (e.g., 21, 34, 55 days) to identify potential turning points in the market:
21 days (~1 month): Perfect for capturing intermediate waves within patterns. This interval often marks the completion of smaller degree waves.
34 days (~7 weeks): The sweet spot that balances minor and major moves. When a trend has persisted for approximately 34 days, watch for signs of reversal or continuation.
55 days (~11 weeks): It is ideal for large trends, helps filter out market noise, and identifies significant wave completions.
Setting Peak Detection Parameters
When using algorithms to identify Elliott Waves (as shown in the code example), incorporating these Fibonacci-based distance parameters can dramatically improve accuracy:
# Using Fibonacci-based distance values
peaks, _ = find_peaks(prices, distance=55)  # For major trends
troughs, _ = find_peaks(-prices, distance=55)  # For major trends

# For intermediate analysis
intermediate_peaks, _ = find_peaks(prices, distance=34)
intermediate_troughs, _ = find_peaks(-prices, distance=34)

# For shorter-term analysis
short_term_peaks, _ = find_peaks(prices, distance=21)
short_term_troughs, _ = find_peaks(-prices, distance=21)
By layering analyses at these different Fibonacci intervals, you can identify waves within waves… the fractal nature of market movements becomes clear.
Applying Elliott Wave Theory to stock prices
Let’s dive into a working example that you can run in Google Colab.
Step 1: Install and Import Libraries
!pip install yfinance -q

import yfinance as yf
import numpy as np
import matplotlib.pyplot as plt
from scipy.signal import find_peaks
import pandas as pd
import matplotlib.dates as mdates
yfinance: A library to download market data from Yahoo Finance.
numpy: A library for numerical computations.
matplotlib.pyplot: A plotting library for creating static, animated, and interactive visualizations.
scipy.signal.find_peaks: A function to find peaks in a signal.
pandas: A library for data manipulation and analysis.
matplotlib.dates: A module for handling dates in matplotlib.
Step 2: Fetch Stock Data
stock = yf.download('SCG.AX', start='2020-01-01', end='2025-03-20')
prices = np.array(stock['Close'].values).flatten()
dates = stock.index
dates_num = mdates.date2num(dates)
yf.download: Downloads historical stock data for the specified ticker (
VCX.AX) and date range.prices: Extracts the closing prices and flattens them into a 1D array.
dates: Extracts the dates corresponding to the closing prices.
dates_num: Converts the dates to a numerical format for easy plotting.
Step 3: Detect Peaks and Troughs
peaks, _ = find_peaks(prices, distance=55)
troughs, _ = find_peaks(-prices, distance=55)
Identifies peaks in the price data. The
distanceparameter ensures that peaks are at least 55 days apart.Identifies troughs by finding peaks in the inverted price data.
Step 4: Identify Elliott Wave Patterns
def identify_elliott_waves(prices, dates_num, peaks_idx, troughs_idx):
    wave_points = []
   ...
    # Find starting low point
    initial_points = [p for p in wave_points if p['date'] < dates_num[100]]
   ...
    # Wave 1
    wave1_candidates = [p for p in remaining_points if p['type'] == 'peak']
    if wave1_candidates:
        wave1_peak = wave1_candidates[0]
        wave_labels.append({
            'point': wave1_peak,
            'label': '1',
            'description': 'Wave 1 Peak'
        })

...
    return wave_labels
This function identifies the Elliott Wave patterns by iterating through the peaks and troughs and labeling them according to the Elliott Wave Theory (Waves 1–5 and corrective Waves A-C).
Step 5: Plot the Data
plt.close('all')
fig = plt.figure(figsize=(16, 8))
...
plt.title('VCX Stock with Elliott Wave Analysis (2020-2025)', fontsize=16)
plt.xlabel('Date', fontsize=12)
plt.ylabel('Price (USD)', fontsize=12)
plt.grid(True, linestyle='--', alpha=0.7)
plt.legend(loc='upper left')
plt.gcf().autofmt_xdate()
plt.tight_layout()

plt.show()
plt.plot: Plots the closing prices, peaks, and troughs.
plt.annotate: Adds labels to the identified Elliott Wave points.
plt.title, plt.xlabel, plt.ylabel: Adds titles and labels to the plot.
plt.grid: Adds a grid to the plot for better readability.
plt.legend: Adds a legend to the plot.
plt.show: Displays the plot.
Step 6: Print Wave Details
print("\nElliott Wave Points Identified:")
print("-" * 50)
for wave in wave_labels:
point_date = mdates.num2date(wave['point']['date']).strftime('%Y-%m-%d')
print(f"{wave['label']}: {wave['description']} - Date: {point_date}, Price: ${wave['point']['price']:.2f}")
...
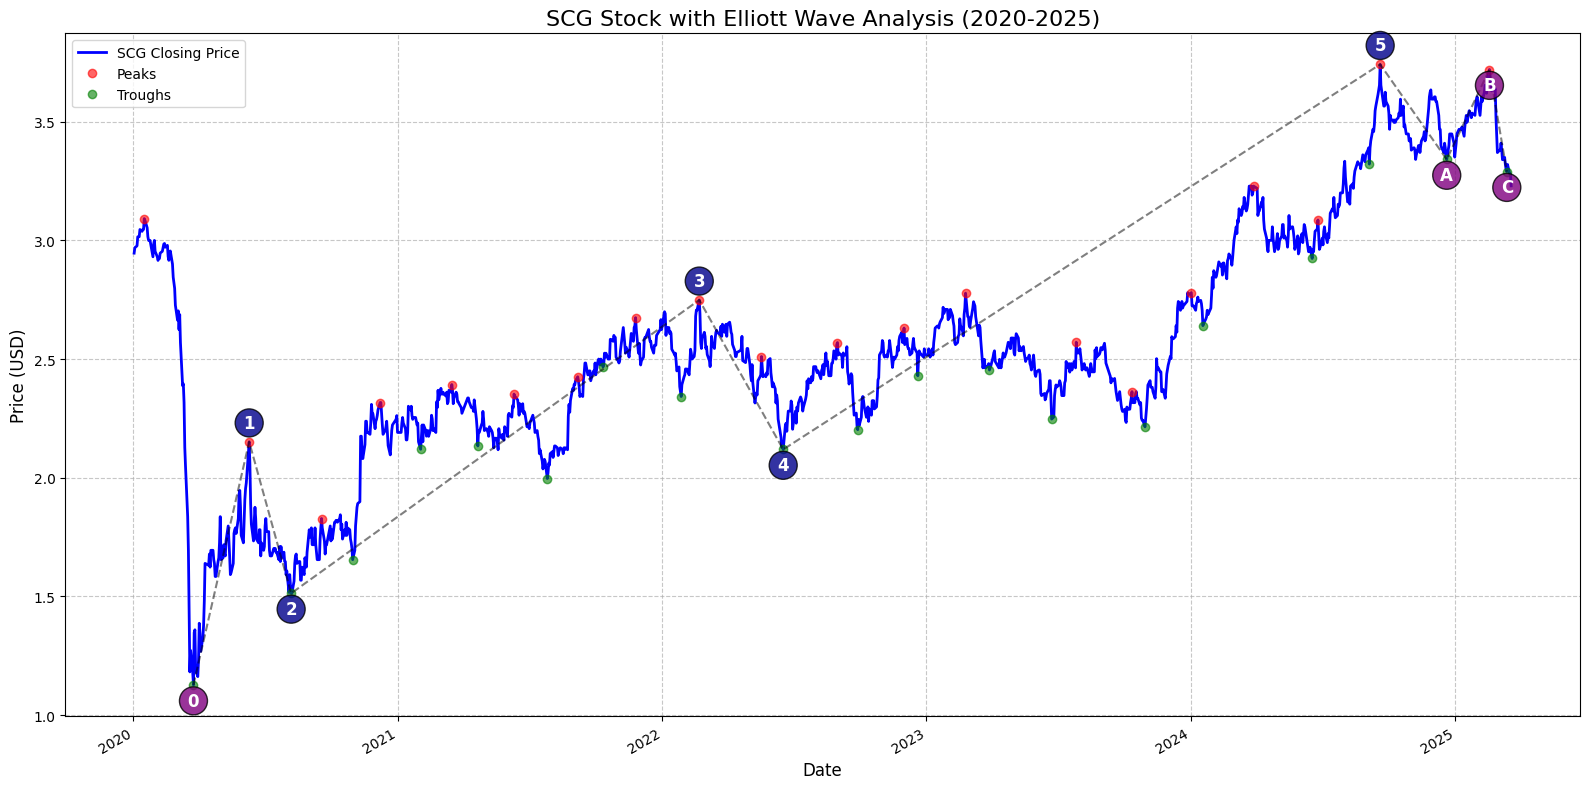
Result:
Elliott Wave Points Identified:
--------------------------------------------------
0: Start - Date: 2020-03-27, Price: $0.74
1: Wave 1 Peak - Date: 2020-06-09, Price: $1.42
2: Wave 2 Trough - Date: 2020-08-06, Price: $0.98
3: Wave 3 Peak - Date: 2022-08-09, Price: $1.77
4: Wave 4 Trough - Date: 2022-09-27, Price: $1.45
5: Wave 5 Peak - Date: 2024-09-19, Price: $2.33
A: Corrective Wave A - Date: 2024-12-13, Price: $1.98
B: Corrective Wave B - Date: 2025-02-17, Price: $2.23
C: Corrective Wave C - Date: 2025-03-14, Price: $2.09Beyond the Basics: The Fractal Nature of Elliott Waves 🔬
Perhaps the most fascinating aspect of Elliott Wave Theory is its fractal nature. Waves exist within waves within waves… creating patterns that repeat across different timeframes.
Each wave can be broken down into smaller sub-waves, and each of those can be broken down further. Elliott identified nine degrees of waves, from Grand Supercycle (spanning decades or centuries) down to Subminuette (lasting mere minutes).
This fractal quality allows analysts to zoom in or out to identify waves at different degrees, creating a comprehensive roadmap of market movements.
Elliott Waves aren’t just mathematical patterns — they’re manifestations of mass psychology.
The impulse waves (1–5) represent the dominant market sentiment:
Waves 1–3: Growing optimism
Waves 3–5: Exuberance turning to exhaustion
The corrective waves (A-C) represent the countertrend:
Wave A: Initial doubt
Wave B: Hope of continuation
Wave C: Resignation
Understanding these psychological underpinnings can help you maintain perspective when emotions run high in the market.
Is Elliott Wave Theory Perfect? 🤷♂️
No market analysis tool is infallible, and Elliott Wave Theory is no exception. Critics point to:
Subjective interpretation (different analysts might count waves differently)
Reliability issues in choppy markets
The challenge of identifying the correct degree of trend
Yet proponents argue these aren’t flaws in the theory itself, but rather… challenges in its application. With practice and discipline, wave counting becomes more consistent.
Conclusion: Should You Ride the Waves? 🏄♀️
Elliott Wave Theory offers a compelling framework for understanding market behavior, but it’s most powerful when combined with other technical analysis tools.
Consider using Elliott Waves alongside:
Fibonacci retracements (which often align with wave targets)
RSI and other momentum indicators (to confirm wave strength)
Volume analysis (particularly for validating Wave 3)
The chart above shows a textbook Elliott Wave pattern, complete with the five impulse waves up and the beginning of a corrective phase. But even perfect patterns don’t guarantee future performance.
So, are you ready to start seeing the waves? The patterns are there… waiting to be discovered. 🌊
Try the complete code example in our shared Google Colab notebook: ElliotWave