Business as usual? No thanks.
The problem with most business news? It’s too long, too boring, and way too complicated.
Morning Brew fixes all three. In five minutes or less, you’ll catch up on the business, finance, and tech stories that actually matter—written with clarity and just enough humor to keep things interesting.
It’s quick. It’s free. And it’s how over 4 million professionals start their day. Signing up takes less than 15 seconds—and if you’d rather stick with dense, jargon-packed business news, you can always unsubscribe.
🚀 Your Investing Journey Just Got Better: Premium Subscriptions Are Here! 🚀
It’s been 4 months since we launched our premium subscription plans at GuruFinance Insights, and the results have been phenomenal! Now, we’re making it even better for you to take your investing game to the next level. Whether you’re just starting out or you’re a seasoned trader, our updated plans are designed to give you the tools, insights, and support you need to succeed.
Here’s what you’ll get as a premium member:
Exclusive Trading Strategies: Unlock proven methods to maximize your returns.
In-Depth Research Analysis: Stay ahead with insights from the latest market trends.
Ad-Free Experience: Focus on what matters most—your investments.
Monthly AMA Sessions: Get your questions answered by top industry experts.
Coding Tutorials: Learn how to automate your trading strategies like a pro.
Masterclasses & One-on-One Consultations: Elevate your skills with personalized guidance.
Our three tailored plans—Starter Investor, Pro Trader, and Elite Investor—are designed to fit your unique needs and goals. Whether you’re looking for foundational tools or advanced strategies, we’ve got you covered.
Don’t wait any longer to transform your investment strategy. The last 4 months have shown just how powerful these tools can be—now it’s your turn to experience the difference.
Geraldine Weiss didn’t shout on CNBC or play poker with Wall Street insiders. She quietly beat the market with a simple, disciplined strategy rooted in dividend yields and common sense. Today, her method is still under the radar and worth a serious look.

Wall Street’s Morning Edge.
Investing isn’t about chasing headlines — it’s about clarity. In a world of hype and hot takes, The Daily Upside delivers real value: sharp, trustworthy insights on markets, business, and the economy, written by former bankers and seasoned financial journalists.
That’s why over 1 million investors — from Wall Street pros to Main Street portfolio managers — start their day with The Daily Upside.
Invest better. Read The Daily Upside.
How Geraldine Weiss’s Method Works
Weiss believed dividends tell the truth when earnings don’t. Her core idea: a stock has a “value range” defined by its historical dividend yield. If the yield is high (price is low relative to dividends), it’s potentially undervalued. If the yield is low (price is high), it may be overvalued.
Here’s the gist:
Focus on blue-chip dividend stocks — typically with 25+ years of consistent dividends.
Find historical high and low dividend yields (e.g., 10-year range).
Buy when the current yield is near the high end (suggesting undervaluation).
Sell when the yield drops toward the low end (indicating overvaluation).
This approach forces you to buy low, sell high — without guessing where the market’s headed.
Performance That Demands Respect
Weiss’s newsletter, Investment Quality Trends, ran this strategy for decades. Between 1966 and 2002, it averaged about 11% annually, compared to the S&P 500’s 10%. But it wasn’t just the return, it was the smoother ride. Lower drawdowns. Less drama. Fewer speculative bets.
She didn’t just beat the market; she taught people how to do it rationally.
How the Bands Are Calculated
The formula to flip yield into a price is simple:
Fair Price = Dividend / Target Yield.
So, if a stock’s current dividend is $4 and:
the historical high yield is 4% → low band = $4 / 0.04 = $100
the historical low yield is 2% → high band = $4 / 0.02 = $200
That means the fair value range is $100–$200. If the stock is trading below $100, it’s likely undervalued. Above $200, it’s probably overpriced.
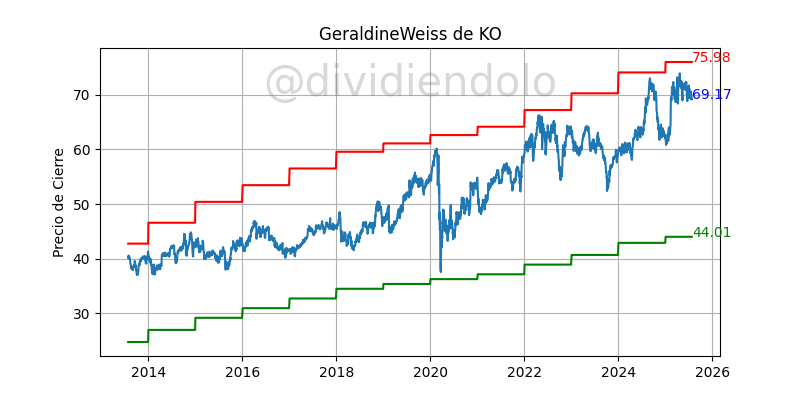
We can see the example of Coca Cola extrated from a web.

The price of Coca cola is in the normal range, close to be overvalued.
Python code
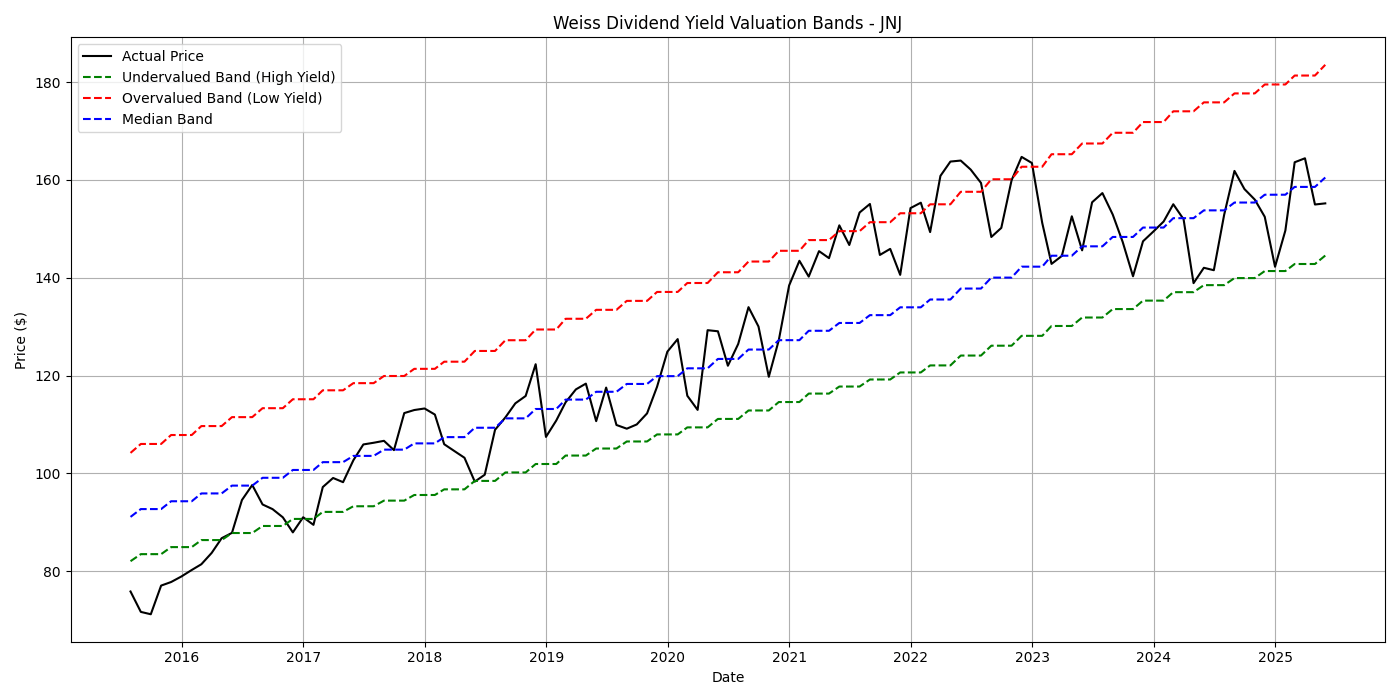
Here you can create your own bands:
import yfinance as yf
import pandas as pd
import matplotlib.pyplot as plt

# Choose stock and download data
ticker = "JNJ"
stock = yf.Ticker(ticker)
price = stock.history(period="10y")["Close"]
dividends = stock.dividends

# Resample dividends to monthly sum, then compute TTM dividend
monthly_div = dividends.resample("M").sum()
ttm_div = monthly_div.rolling(window=12).sum()

# Align dividend and price on same monthly index
price_monthly = price.resample("M").last()
df = pd.DataFrame({
    "Price": price_monthly,
    "TTM_Dividend": ttm_div
}).dropna()

# Calculate dividend yield
df["Yield"] = df["TTM_Dividend"] / df["Price"]

# Compute historical yield thresholds
high_yield = df["Yield"].quantile(0.9)
low_yield = df["Yield"].quantile(0.1)
median_yield = df["Yield"].median()

# Calculate Weiss valuation bands
df["Low_Band"] = df["TTM_Dividend"] / high_yield
df["High_Band"] = df["TTM_Dividend"] / low_yield
df["Mid_Band"] = df["TTM_Dividend"] / median_yield

# Plotting
plt.figure(figsize=(14, 7))
plt.plot(df["Price"], label="Actual Price", color="black")
plt.plot(df["Low_Band"], label="Undervalued Band (High Yield)", linestyle="--", color="green")
plt.plot(df["High_Band"], label="Overvalued Band (Low Yield)", linestyle="--", color="red")
plt.plot(df["Mid_Band"], label="Median Band", linestyle="--", color="blue")

plt.title(f"Weiss Dividend Yield Valuation Bands - {ticker}")
plt.xlabel("Date")
plt.ylabel("Price ($)")
plt.legend()
plt.grid(True)
plt.tight_layout()
plt.show()
Conclusions
I think it is a very interesting method to identify undervalued stocks. Personally, I would add or remove some of the filters that it makes.
For example, I would not take into account that the dividend should be increasing for at least 25 years. There may be many good companies that have not had a growing dividend for so many years, either because of longevity or for various reasons. I would also monitor the payout to see if the dividends are sustainable over time.
Former Zillow exec targets $1.3T market
The wealthiest companies tend to target the biggest markets. For example, NVIDIA skyrocketed nearly 200% higher in the last year with the $214B AI market’s tailwind.
That’s why investors are so excited about Pacaso.
Created by a former Zillow exec, Pacaso brings co-ownership to a $1.3 trillion real estate market. And by handing keys to 2,000+ happy homeowners, they’ve made $110M+ in gross profit to date. They even reserved the Nasdaq ticker PCSO.
No wonder the same VCs behind Uber, Venmo, and eBay also invested in Pacaso. And for just $2.90/share, you can join them as an early-stage Pacaso investor today.
Paid advertisement for Pacaso’s Regulation A offering. Read the offering circular at invest.pacaso.com. Reserving a ticker symbol is not a guarantee that the company will go public. Listing on the NASDAQ is subject to approvals.
Looking at free cash flow relative to dividends gives an idea of sustainability. In the case of Coca Cola, it can be seen that the dividend payment is much higher than the free cash flow, so it may be convenient to reduce these dividends, in order not to increase debt.
I would also comment that I would not apply this method to growth companies, such as technology companies, because they do not usually pay out dividends or pay very low dividends.
I hope you found this method interesting.
Thank you very much for your attention!


