
In partnership with

Marketing ideas for marketers who hate boring

The best marketing ideas come from marketers who live it. That’s what The Marketing Millennials delivers: real insights, fresh takes, and no fluff. Written by Daniel Murray, a marketer who knows what works, this newsletter cuts through the noise so you can stop guessing and start winning. Subscribe and level up your marketing game.
🚀 Your Investing Journey Just Got Better: Premium Subscriptions Are Here! 🚀
It’s been 4 months since we launched our premium subscription plans at GuruFinance Insights, and the results have been phenomenal! Now, we’re making it even better for you to take your investing game to the next level. Whether you’re just starting out or you’re a seasoned trader, our updated plans are designed to give you the tools, insights, and support you need to succeed.
Here’s what you’ll get as a premium member:
Exclusive Trading Strategies: Unlock proven methods to maximize your returns.
In-Depth Research Analysis: Stay ahead with insights from the latest market trends.
Ad-Free Experience: Focus on what matters most—your investments.
Monthly AMA Sessions: Get your questions answered by top industry experts.
Coding Tutorials: Learn how to automate your trading strategies like a pro.
Masterclasses & One-on-One Consultations: Elevate your skills with personalized guidance.
Our three tailored plans—Starter Investor, Pro Trader, and Elite Investor—are designed to fit your unique needs and goals. Whether you’re looking for foundational tools or advanced strategies, we’ve got you covered.
Don’t wait any longer to transform your investment strategy. The last 4 months have shown just how powerful these tools can be—now it’s your turn to experience the difference.

I was working on analyzing SPY stock data and I was happy with the daily price trends, but finding hidden patterns was very difficult. The data was full of noise from market swings and I couldn’t spot consistent behaviors with basic tools. I tried looking at moving averages, but it just smoothed everything out without showing the real story. Then I discovered Latent Gaussian Mixture Models, or LGMM, which helped me break the chaos into clear groups. It worked well and revealed clusters like stable periods or volatile spikes in SPY data. As a data scientist, I’ve used LGMM for stock data, text analysis, and more. If you’re struggling with messy market data, this guide is for you. I’ll show why LGMM beats other methods, include chart comparisons, and explain how quants or technical analysts can benefit. It’s simpler than it seems and can change how you see your data.
Inventory Software Made Easy—Now $499 Off

Looking for inventory software that’s actually easy to use?
inFlow helps you manage inventory, orders, and shipping—without the hassle.
It includes built-in barcode scanning to facilitate picking, packing, and stock counts. inFlow also integrates seamlessly with Shopify, Amazon, QuickBooks, UPS, and over 90 other apps you already use
93% of users say inFlow is easy to use—and now you can see for yourself.
Try it free and for a limited time, save $499 with code EASY499 when you upgrade.
Free up hours each week—so you can focus more on growing your business.
✅ Hear from real users in our case studies
🚀 Compare plans on our pricing page
What is Latent Gaussian Mixture Models?
Latent Gaussian Mixture Models are a way to find hidden groups in data that looks all mixed up. The concept is that the data comes from several Gaussian distributions, like bell curves, blended with unseen structures. I read a paper by Reynolds (2009) that explained this and it’s like sorting a basket of mixed fruits into apples, oranges, and bananas based on subtle differences. Each group has a mean, the center, and a variance, showing how spread out it is. LGMM uses Expectation-Maximization, or EM, to estimate these by guessing and refining over iterations.
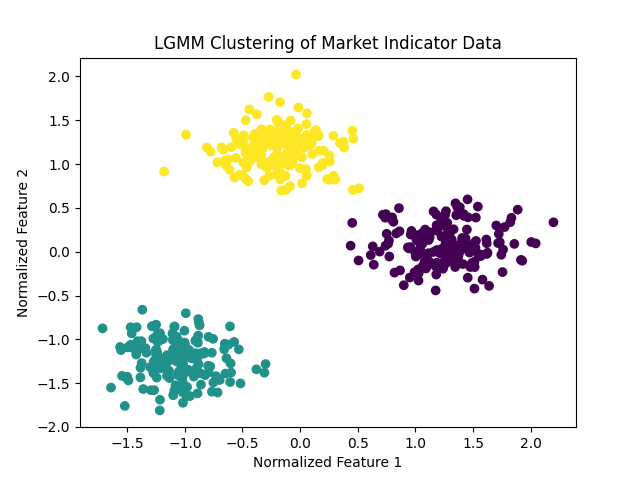
Fig 0: LGMM Clusters
The probability for a data point x in group k is calculated with this scientific formula:
P(x|k) = 1 / √(2 π σ_k²) e^(-(x — μ_k)² / (2 σ_k²))
In this, μ_k is the mean, which marks the center of the group, and σ_k² is the variance, showing how spread out the data is. This formula measures how well each point fits into its group, cutting through noise to reveal hidden trends by focusing on the shape of the data distribution. It’s excellent for complex datasets like SPY stock patterns or text, but it can struggle if you choose too many groups or if outliers skew the results. I found it perfect for SPY data, text analysis, or any dataset with hidden layers waiting to be discovered.
How LGMM Works
I applied LGMM to SPY stock data and it follows a clear process. First, you prepare the data by normalizing features like returns or volatility to the same scale. I used z-score normalization, subtracting the mean and dividing by the standard deviation, which balanced the SPY metrics. Then you pick a number of components, the groups you think exist. I started with three based on market states I suspected.
The EM algorithm handles the rest with two steps: the E-step calculates probabilities of each point belonging to a group, and the M-step updates the mean and variance. This repeats until changes are small. Next, you evaluate with the Bayesian Information Criterion, or BIC, to check the fit. I tried four components once and BIC rose, so three was better. Finally, you assign points to groups and visualize. I made a flowchart to map this and it kept me focused. Noisy SPY data was a hurdle, but tweaking components solved it.
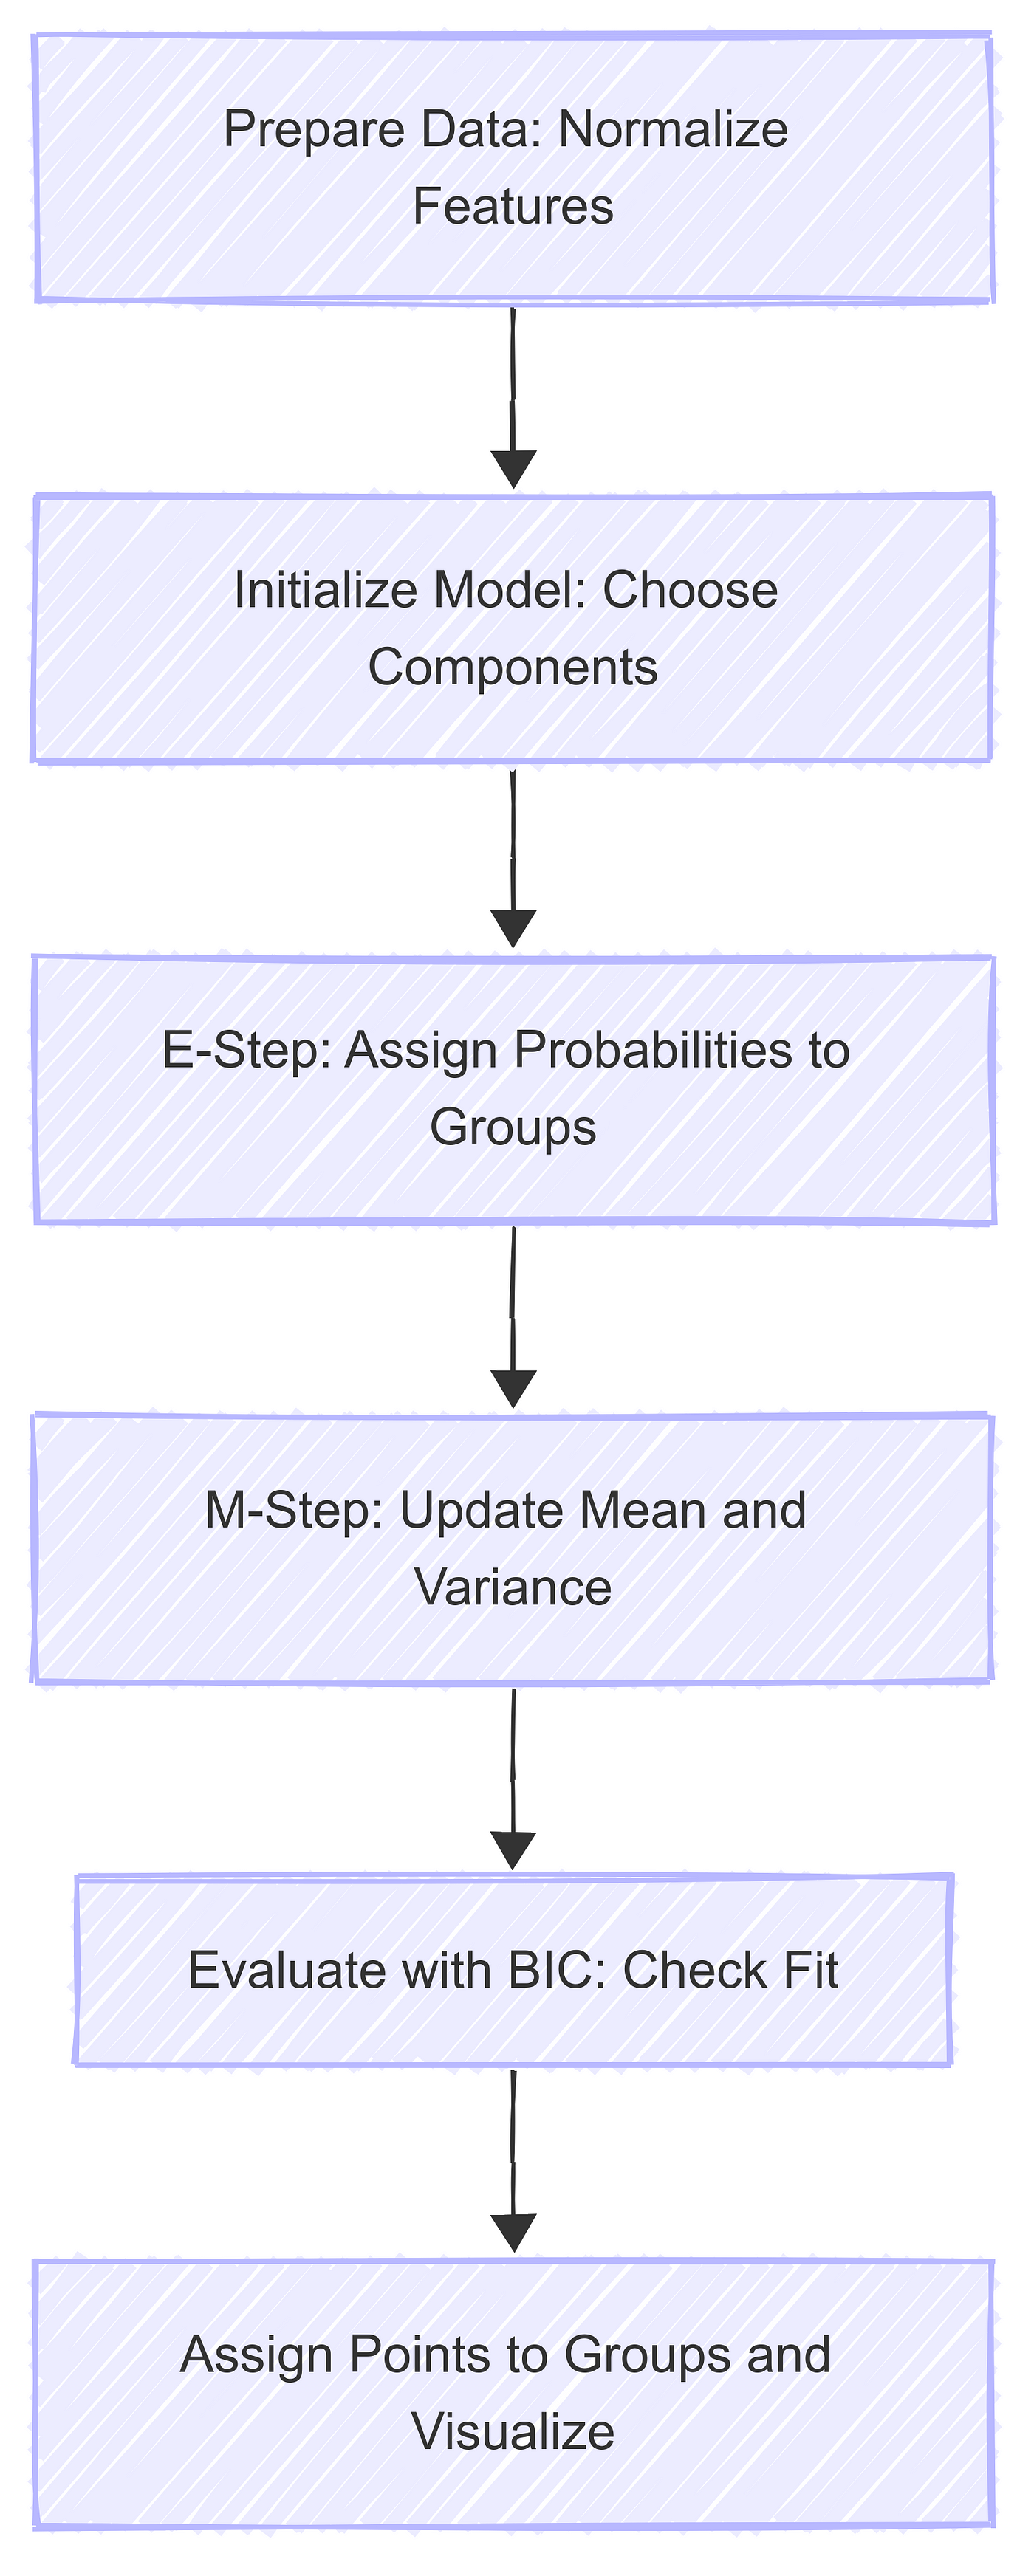
Figure 1: LGMM Workflow
How LGMM Solves the Problem: Chart Comparisons
Without LGMM, SPY data looks like a random scatter with no structure.
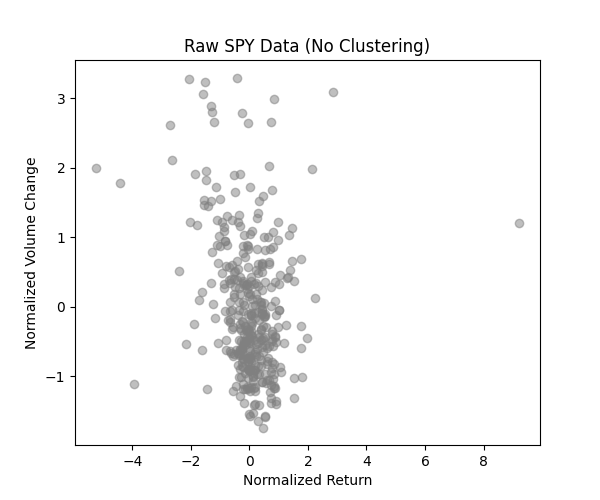
Figure 2: Raw SPY Data (No Clustering)
It’s a cloud of points with no clear meaning, making it hard to spot trends.
Using LGMM, the same data transforms into three distinct clusters, as shown in your plot.
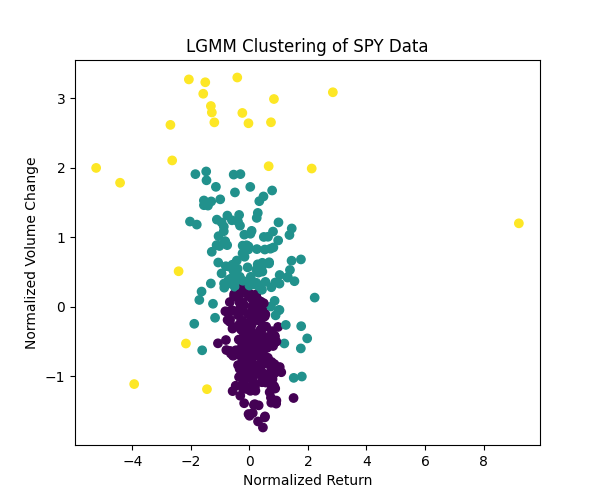
Figure 3: LGMM Clustering of SPY Data
The yellow, purple, and teal groups reveal stable, volatile, and mixed market periods, solving the noise problem by highlighting patterns.
Compared to other models, LGMM shines. K-means forces spherical clusters, missing overlaps in SPY data.
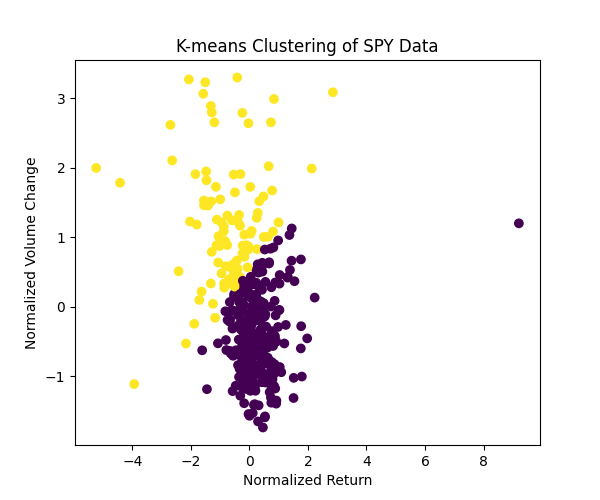
Figure 4: K-means Clustering of SPY Data
It’s less flexible. Hidden Markov Models, or HMM, assume sequences, which SPY’s daily data doesn’t follow well.
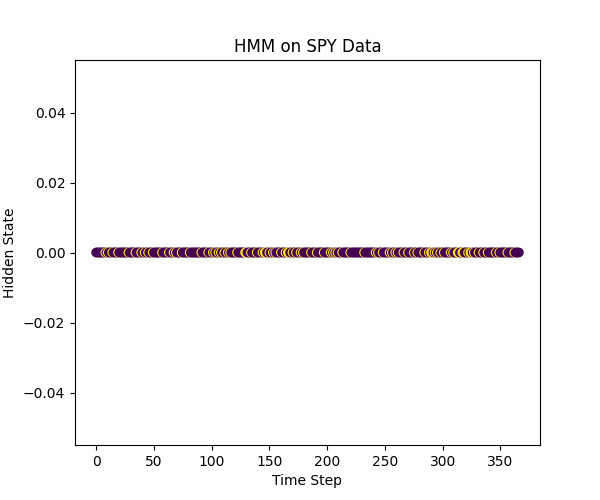
Figure 5: HMM on SPY Data
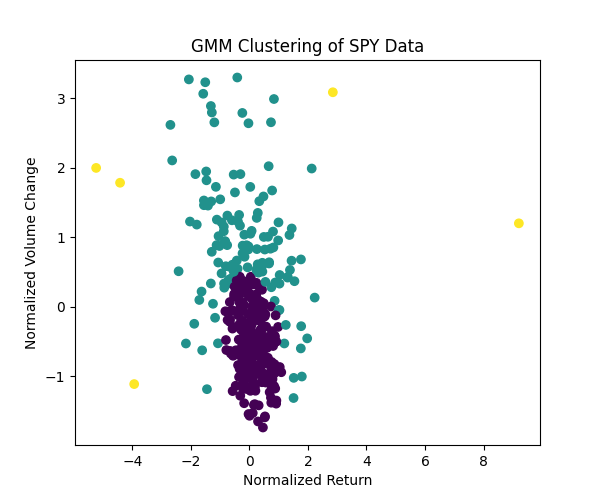
Figure 6: GMM Clustering of SPY Data
Gaussian Mixture Models, or GMM, handle overlaps but lack LGMM’s latent structure focus. LGMM’s ability to model latent factors made it the winner for my SPY analysis.
Hands-On Example
I tested LGMM on SPY data with a Python example you can try. It’s adaptable for other datasets.
Step 1: Set Up Environment
I set up my Python tools.
pip install sklearn numpy matplotlib yfinanceStep 2: Load SPY Data
I fetched SPY data.
import yfinance as yf
import numpy as np
spy = yf.download('SPY', start='2024-01-01', end='2025-06-01')
data = np.column_stack((spy['Close'].pct_change().dropna(), spy['Volume'].pct_change().dropna()))This gave me returns and volume changes.
Step 3: Normalize Data
I balanced the features.
mean = np.mean(data, axis=0)
std = np.std(data, axis=0)
data_normalized = (data - mean) / std
Step 4: Apply LGMM
I fit the model.
from sklearn.mixture import GaussianMixturelgmm = GaussianMixture(n_components=3, random_state=42)
lgmm.fit(data_normalized)
labels = lgmm.predict(data_normalized)Step 5: Visualize
I plotted the clusters.
import matplotlib.pyplot as pltplt.scatter(data_normalized[:, 0], data_normalized[:, 1], c=labels, cmap='viridis')
plt.title('LGMM Clustering of SPY Data')
plt.xlabel('Normalized Return')
plt.ylabel('Normalized Volume Change')
plt.savefig('spy_lgmm_plot.png')
plt.show()print(f"BIC Score: {lgmm.bic(data_normalized):.2f}")This showed SPY’s hidden patterns.
Benefits for Quants and Technical Analysts
A quant analyst can use LGMM to identify market regimes in SPY data, like stable or volatile periods, to adjust risk models or pricing strategies. The clusters help predict when volatility spikes, improving option pricing accuracy. A technical analyst benefits by spotting trend changes early, using the groups to set better entry and exit points for trades. LGMM’s clarity over raw data or other models gives them an edge in decision-making.
Lessons and Applications
Here’s what I learned and why LGMM stood out:
Start with a small number of components and check BIC to avoid overfitting: BIC balances fit and complexity. A lower score means a better model, like tuning a radio to the clearest station. I started with two and BIC was high, so three worked better, avoiding fake patterns.
Normalize data or results get skewed: Without it, returns could drown out volume, like a loud drum overtaking a melody. Z-score fixed this.
Test initial guesses with noisy data: SPY’s volatility misled my first run, so I tried multiple starts and picked the best BIC.
LGMM handles overlaps better than K-means: Its Gaussians flex to fit SPY’s complex clusters, unlike K-means’ rigid shapes.
I learned BIC isn’t just a check — it’s a guide to avoid chasing noise, saving me from bad fits.
LGMM works for SPY data, text clustering, or sensor analysis, turning noise into insights.
Conclusion
LGMM solved my SPY data puzzle by revealing hidden patterns where raw data and other models failed. It turned noise into clear clusters, beating HMM’s sequence focus, GMM’s simplicity, and K-means’ rigidity. If you’re tackling similar data, try it with the code above or explore scikit-learn’s docs. Share your results in the comments, I’d be happy to hear how it goes. Check Reynolds (2009) for more on Gaussian mixtures.