
I noticed quite a few commenters panicking about being on a losing streak from lurking here. This post is for them, here’s my two cents on how to find out if your losing streak is normal and expected, or if it’s a sign that something is going wrong
Step 1: Check your trading journal for mistakes
Reference your trading journal to check if the losses you incurred can be tied back to any mistakes made on your part.
If you don’t have a trading journal, create one on google sheets (its free) right now and include at least these columns:
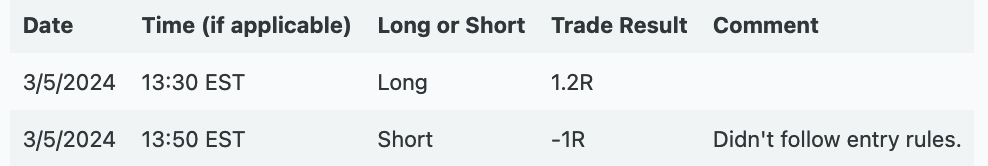
Only leave comments if you made a mistake in execution (broke entry/exit rules, FOMO’d into a trade, added to a loss, took significant slippage, forgot to avoid NFP release, etc.). Leave it blank otherwise.
After 25–50 trades, come back and see what mistake was most common, and work on that for the next 25–50 trades. Repeat this cycle until mistakes don’t occur.
The goal of doing this is to classify your trades as one of the following four:
Correct decision, bad outcome (leave a blank comment, no bad decisions here)
Correct decision, good outcome (leave a blank comment, no bad decisions here)
Incorrect decision, bad outcome (this is a mistake that made you lose the trade)
Incorrect decision, good outcome (this is a mistake that got lucky and gave you a win)
So remain patient and keep trading and journaling on a demo or a small account, and know that over time you will eliminate more and more mistakes, bringing you closer to consistent profitability.
If there are no mistakes, move on to the next step.
Step 2: Understand how variance affects a profitable trading strategy
Most losing streaks are a result of probabilistic variance. Unless your winrate is 100% (which is pretty much impossible over a large sample), you’ll have some chance of losing the trade even though you made the correct decision. Here’s an example:
Image 1: Results of 200 trials of flipping a coin 200 times, winning 2R on heads and losing 1R on tails
The strategy used in the above example is profitable. Here’s how you can tell:
Step 1: Find out what the strategy’s winrate, average win size, and average loss size is.
Coin Flip Strategy's Stats:
 - Winrate: 50%
 - Average win: 2 units of risk (2R)
 - Average loss: 1 unit of risk (1R)
Step 2: Use the following formula to determine if this combo of winrate and R:R will be profitable after a large sample of trades. It’ll tell you what your expected value per trade is, which is the amount you can expect to win per trade in the long run. Any value above 0 is profitable. 0 is breakeven. Less than 0 is unprofitable
Expected Value (EV) = (winrate * average win) - (lossrate * average loss)

In this case:
EV = (0.5 * 2) - (0.5 * 1)
EV = 1 - 0.5
EV = 0.5R

So with this coin flip strategy, you can expect to win 0.5 units of risk per coin flip in the long run.
Even though it’s profitable, with a 50% winrate, you can still reasonably expect to lose around 18 trades in a row in your worst losing streaks:
Step 3: Determine what the max likely losing streak is for your strategy
Now that you understand how probabilistic variance can cause some nasty unlucky losing streaks even if you followed your (otherwise profitable) strategy, you can use the following tools to model what variance looks like for your trading strategy:
Here’s the tool from image 2 that calculates the probability of a losing streak depending on your winrate: https://docs.google.com/spreadsheets/d/1-kAxnB4xh-RDrTw-gqIb7iC4qW117Q1dHqgs-vps8cg/edit?usp=drivesdk
And here’s the tool from image 1 that simulates different P&L curves your strategy can experience (only works on desktop): https://aminehadbi.github.io/
Use those to find out if your losing streak length is within the bounds of normal variance. You can also find out what the worst likely normal, mistake-free losing streak you’ll ever experience is.
Knowing this will give you the frame of reference you need to start thinking about winning and losing streaks in terms of probabilities. Combined with your trading journal, it’ll help you isolate mistake-caused losses from normal probability-induced losses.
You can save up to 100% on a Tradingview subscription with my refer-a-friend link. When you get there, click on the Tradingview icon on the top-left of the page to get to the free plan if that’s what you want.