

In partnership with

`
Ease into investing

“Ease” being the key word. With automated tools like portfolio rebalancing and dividend reinvestment, Betterment makes investing easy for you, and a total grind for your money.
Exciting News: Paid Subscriptions Have Launched! 🚀
On September 1, we officially rolled out our new paid subscription plans at GuruFinance Insights, offering you the chance to take your investing journey to the next level! Whether you're just starting or are a seasoned trader, these plans are packed with exclusive trading strategies, in-depth research paper analysis, ad-free content, monthly AMAsessions, coding tutorials for automating trading strategies, and much more.
Our three tailored plans—Starter Investor, Pro Trader, and Elite Investor—provide a range of valuable tools and personalized support to suit different needs and goals. Don’t miss this opportunity to get real-time trade alerts, access to masterclasses, one-on-one strategy consultations, and be part of our private community group. Click here to explore the plans and see how becoming a premium member can elevate your investment strategy!
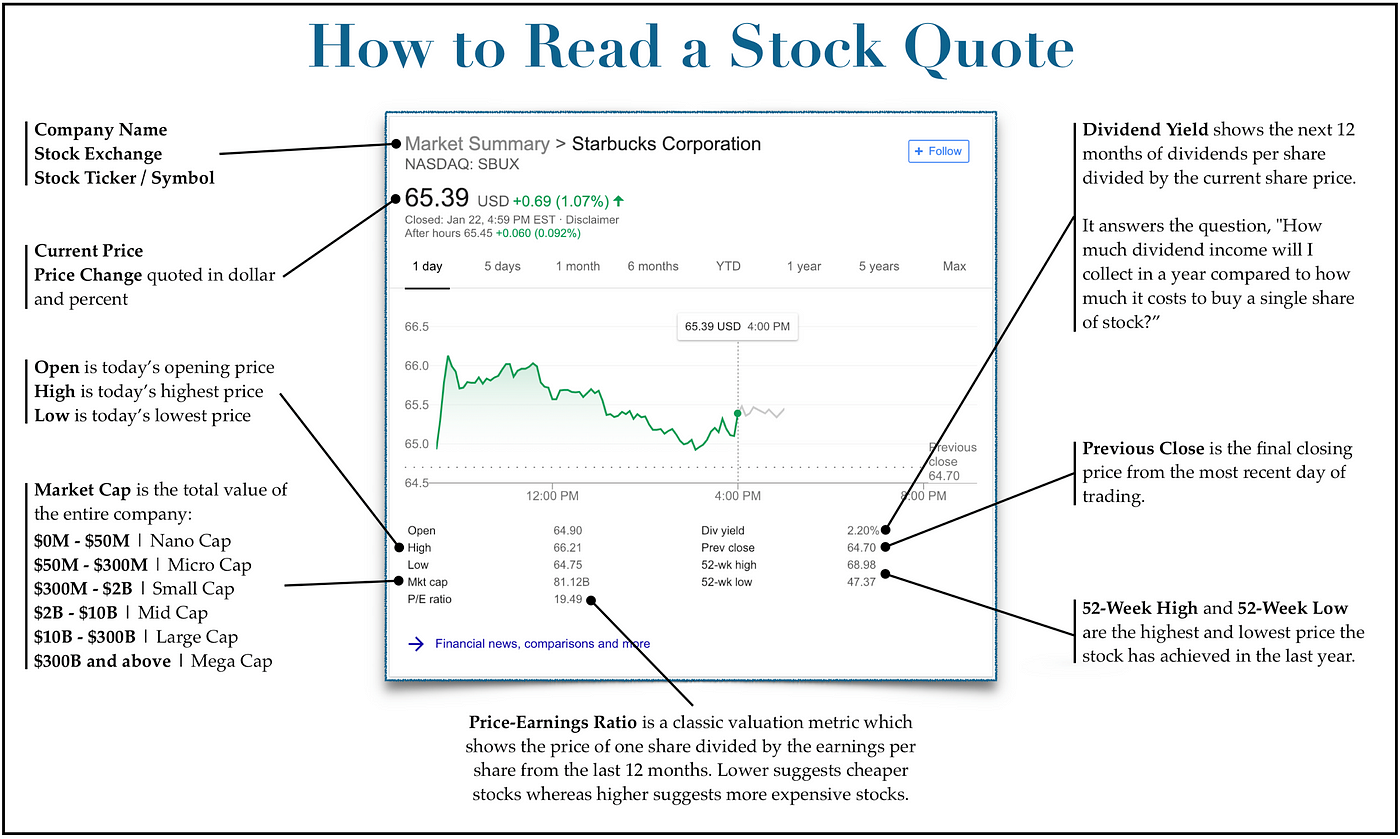
How to read a stock quote
A stock quote is often an investor’s “first stop” to quickly check a prospective stock’s price, trading range, dividend, and P/E ratio.
There are many different versions of stock quotes that provide a wide range of information. Since most investors use Google for their stock lookups, I thought I’d use their simple stock quote as an example.
Let’s expand on each of the key items above in more detail:
Company Name
This provides the full name of the publicly-traded entity.
Stock Exchange
This shows which exchange the stock is trading on (such as the Nasdaq or New York Stock Exchange). This usually doesn’t matter much, unless it’s trading on over-the-counter (OTC) markets, which are often highly speculative.
1 in 16 are diagnosed with lung cancer.
Early detection saves lives
Cizzle Bio’s test is 95% accurate
You can support a patented solution to improve survival rates
Read the Offering information carefully before investing. It contains details of the issuer’s business, risks, charges, expenses, and other information, which should be considered before investing. Obtain a Form C and Offering Memorandum at invest.cizzlebio.com
Stock Ticker/Symbol
This is the shorthand symbol used to identify the stock when looking it up for research or purchase. For stocks the symbol is usually 1–4 letters long, although it can be longer.
Current Price
This is the most recent price available. If markets are currently open, this price will be either real-time or delayed by 15 minutes. If markets are closed, this is typically the closing price from the most recent day of trading.
Price Change
This shows how much the price has changed today (if markets are open) or during the most recent day of trading (if markets are closed). This is quoted in dollars and also percent. We believe percent change is a more useful figure, since a dollar change is meaningless without comparing it to the previous closing price of the stock.
For example, a $5 drop in price could mean a company lost 50% of its value (it was a $10 stock) or it could mean there was almost no change in price at all (it was a $10,000 stock).
On the other hand, regardless of the stock’s price, a 5% drop in price is instantly understandable as a pretty strong decline for a single day of trading.
For this reason, I usually think, research, and write in terms of percentage change.
Open/High/Low
These show the stock’s trading range for the day by providing where it opened, the maximum price it reached, and the minimum price it reached.
These data points are most useful on highly volatile days or to day traders interested in tracking small, intraday price movements. To the average investor looking to buy a stock for weeks, months, or years, the day’s price range is only moderately useful.
Market Cap (or market capitalization)
This is the total value of all the shares of a publicly traded company. Mathematically, it’s the number of shares multiplied by the price per share.
When investors talk about “market caps” they’re simply discussing how big a company is.
Here’s a quick guide to what size company each value range maps to:
$0M — $50M | Nano Cap
$50M — $300M | Micro Cap
$300M — $2B | Small Cap
$2B — $10B | Mid Cap
$10B — $300B | Large Cap
$300B and above | Mega Cap
Most people simply call big companies “large-cap stocks,” mid-size companies “mid-cap stocks”, and small companies “small-cap stocks.” People typically don’t get as specific as “nano-cap” or “mega-cap.”
Price-Earnings Ratio
This is one of the most popular value metrics that investors use to try and determine if a stock is cheap or expensive. It represents the price of one share divided by the earnings per share for the last 12 months.
Another way it is commonly referenced is as the “earnings multiple,” which simply measures how many times the last 12 months earnings per share the stock is trading for. It’s the same figure as price-earnings (or P/E) ratio.
A lower number suggests a cheaper stock, since the price is relatively closer to the last 12 months earnings per share. A higher number suggests a more expensive stock, since an investor would have to pay many multiples of the last 12 months earnings per share to buy the stock.
While price-earnings ratio is the most classic valuation metric, it’s far from the best. For several reasons, it has limited ability to predict whether a stock is truly undervalued or overvalued.
Dividend Yield
This is a measure of how much return the dividend will provide, relative to the current stock price. It divides the next 12 months of dividend income by the current share price.
It answers the question, “How much dividend income will I collect in a year compared to how much it costs to buy a single share of stock?”
While a higher yield usually equates to more dividend income, it can sometimes also mean lower stock price gains or a high dividend payout, which is unsustainable.
We’ll explain how to find the best dividend stocks in our upcoming lesson.
Previous Close
This is the final closing price from the most recent day of trading. From Tuesday to Friday, this is usually the previous calendar day. On Monday, it’s usually last Friday’s closing price.
However, holidays and other events can sometimes result in several days since the stock has last traded.
But in general, the previous close gives you a sense of how investors valued the company during its last trading session.
52-Week High and 52-Week Low
These are the highest and lowest prices the stock has traded at in the trailing year (52 weeks). This can be useful to get a sense of how close the stock currently is to setting new lows or breaking new highs for the year.
For example, a stock with a 52-week high of $100 and a 52-week low of $50 that’s currently trading at $51 is clearly scraping bottom after a massive sell-off.
And vice versa: a stock currently trading at $99.75 with a 52-week low of $40 and a 52-week high of $100 is currently riding a massive rally to new heights.