Is oil and gas missing from your portfolio?
With Klondike Royalties, you could gain from established oil and gas assets. Each royalty offers potential returns from real production, managed by deeply experienced operators. Add a piece of the energy sector to your portfolio.
Exciting News: Paid Subscriptions Have Launched! 🚀
On September 1, we officially rolled out our new paid subscription plans at GuruFinance Insights, offering you the chance to take your investing journey to the next level! Whether you're just starting or are a seasoned trader, these plans are packed with exclusive trading strategies, in-depth research paper analysis, ad-free content, monthly AMAsessions, coding tutorials for automating trading strategies, and much more.
Our three tailored plans—Starter Investor, Pro Trader, and Elite Investor—provide a range of valuable tools and personalized support to suit different needs and goals. Don’t miss this opportunity to get real-time trade alerts, access to masterclasses, one-on-one strategy consultations, and be part of our private community group. Click here to explore the plans and see how becoming a premium member can elevate your investment strategy!
Markets have their own seasonality.
Predictable patterns that unfold at specific times of the year.
Year after year.
Yes, you read that right!
And we’re NOT talking about some Wall Street myth.
This is backed by real historical data.
So if you’re a trader…
Learning this information can give you a remarkable edge.
Instant knowledge boost!
How seasonality works in practice:
Let’s put this into practice by looking at the S&P500.
If we take data from the past ten years and average it into a single chart, something interesting emerges…
Margot Robbie in bubble bath explaining complex finance subjects.

I’m kidding.
A “seasonal chart”.
A “seasonal chart” emerges!
Now, that’s just a fancy way of saying an “average price fluctuation” chart.
I’m not sure which sounds better.
Pick your horse.
Here’s what you can do when your bank starts apologizing
You may have gotten a ‘sorry’ email from your bank, saying that if you had a 5% APY cash account, that privilege is being snatched away. And with interest rates set to keep sinking… where to pivot? But now, for a slice of their portfolio, Masterworks’ art investing platform is offering shares to 66,000+ investors, with each of their 23 sales individually returning a profit to said investors. With 3 illustrative sales, Masterworks investors have realized net annualized returns of +17.6%, +17.8%, and +21.5%!
Past performance not indicative of future returns. Investing Involves Risk. See Important Disclosures at masterworks.com/cd.
I don’t judge!
But now the question is…
How does that chart look like?
Here it is:
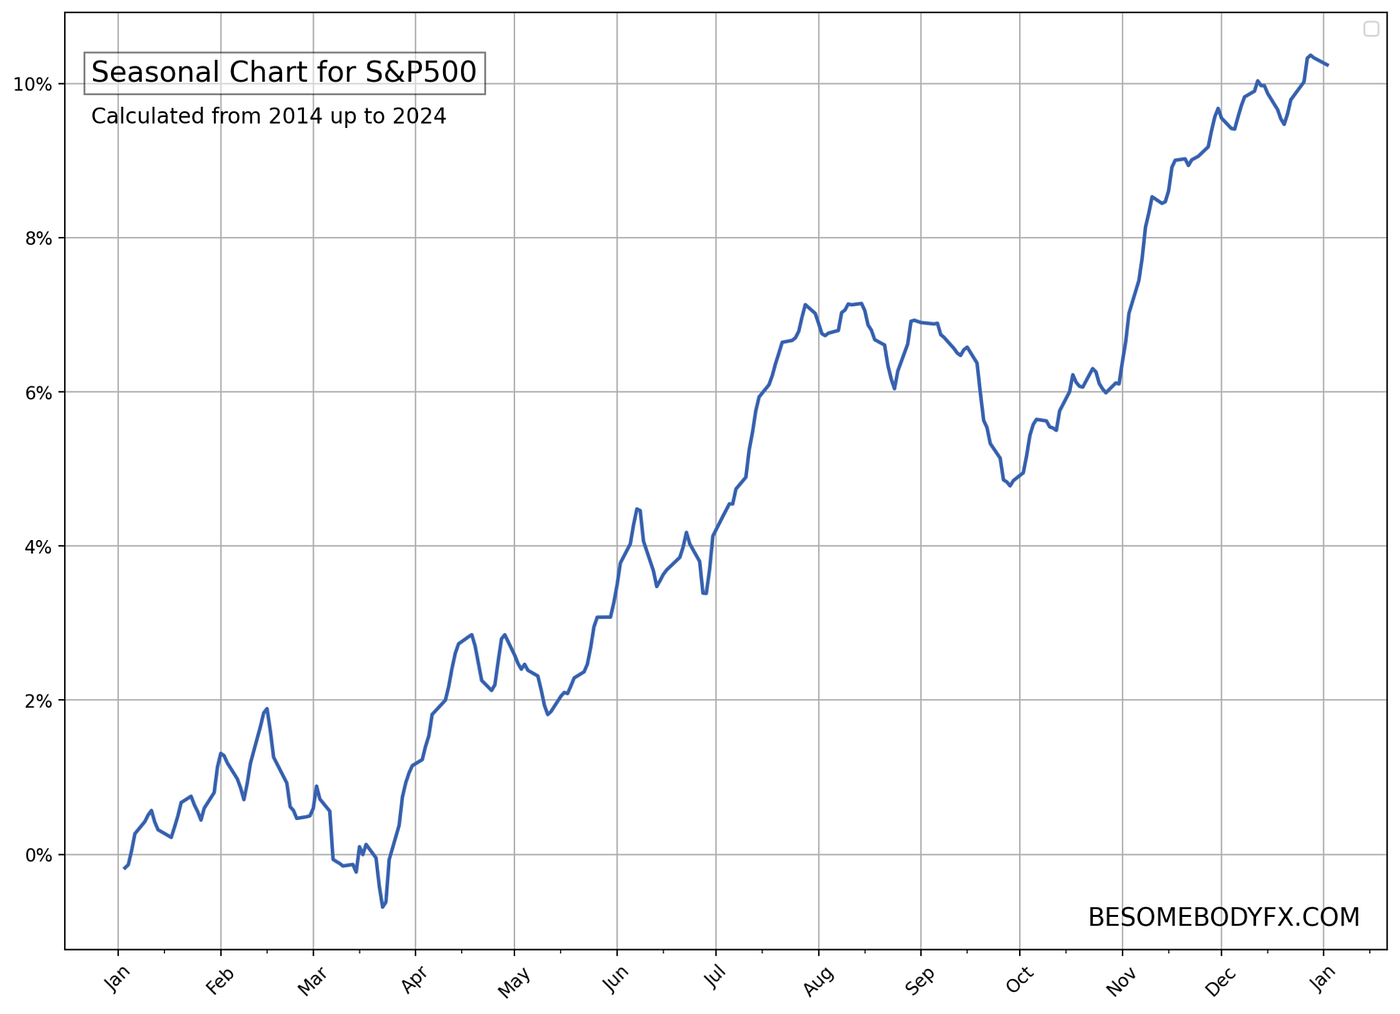
This is basically the S&P500 (daily) prices for the past 10 years lined up and averaged into a single chart.
That’s a seasonal chart.
Basically a visual representation of how the S&P500 tends to move throughout the year.
Makes sense?
Great.
Now, before you roll your eyes in boredom.
I know, Margot Robbie was a little cooler.
But hey!
Bear with me a second.
And let me get to the point!
Here’s where this gets REALLY interesting…
You can clearly see from the chart above that the S&P500 has an undeniable tendency to rally in specific times of the year.
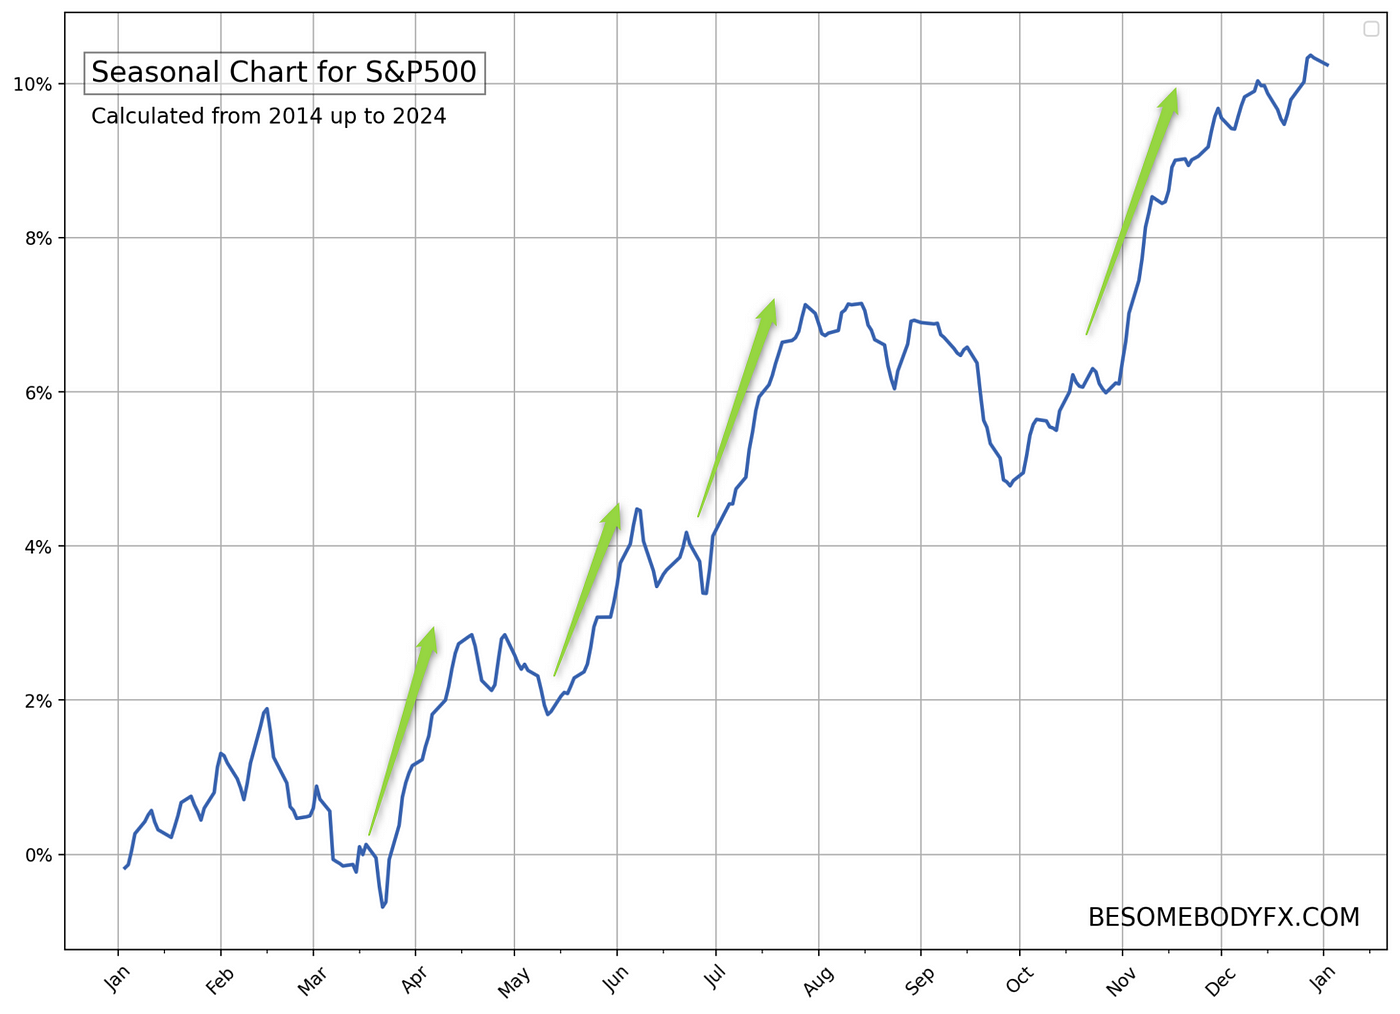
For instance…
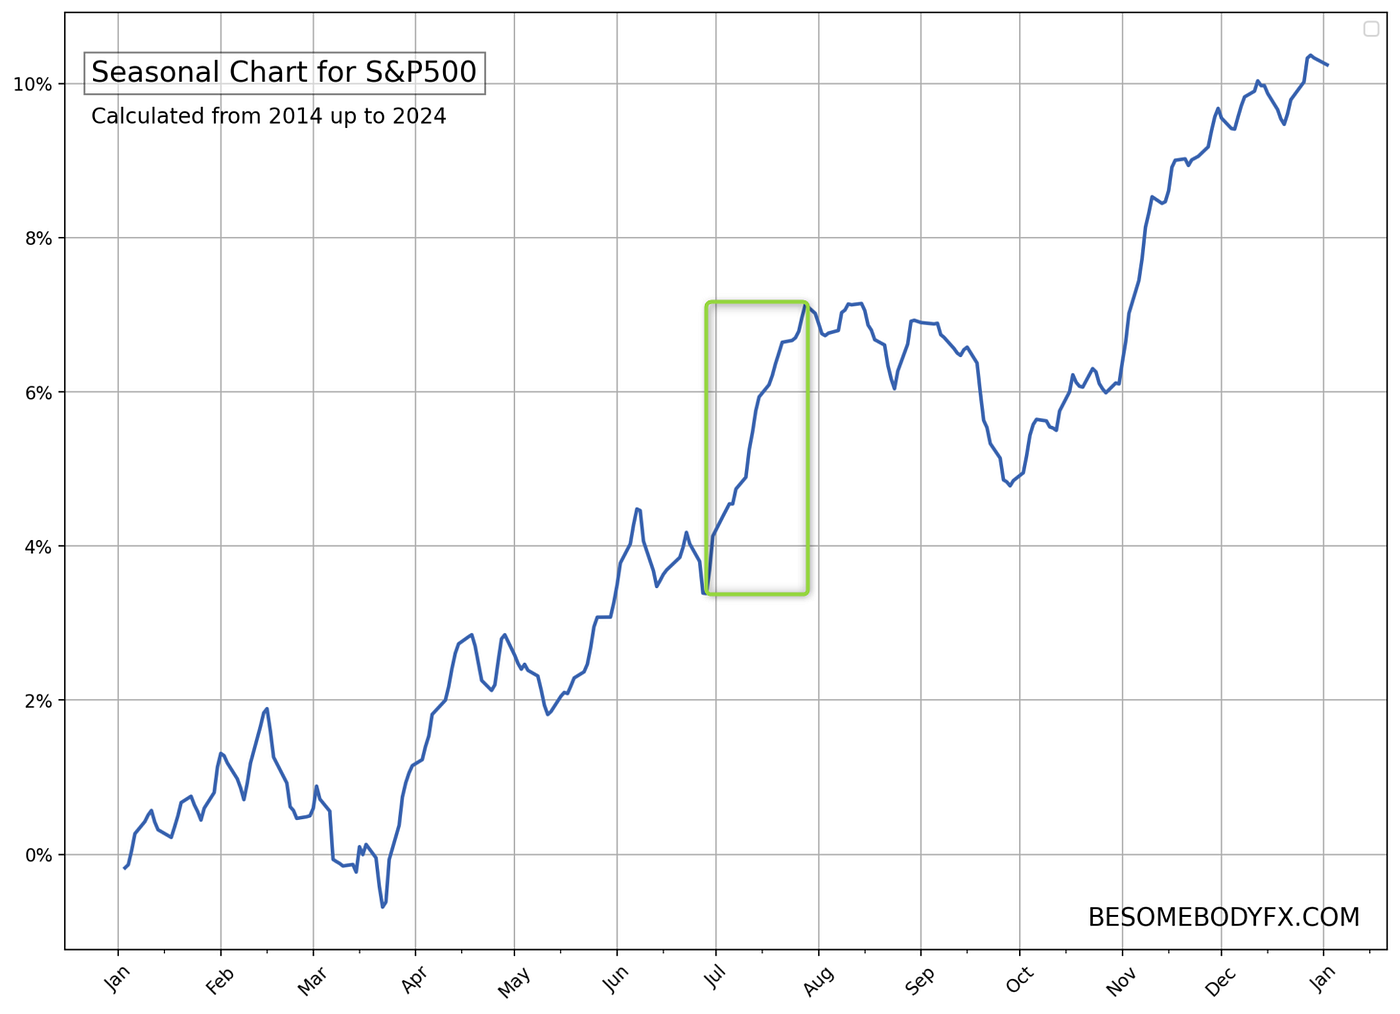
See this specific period in July?
I can tell you…
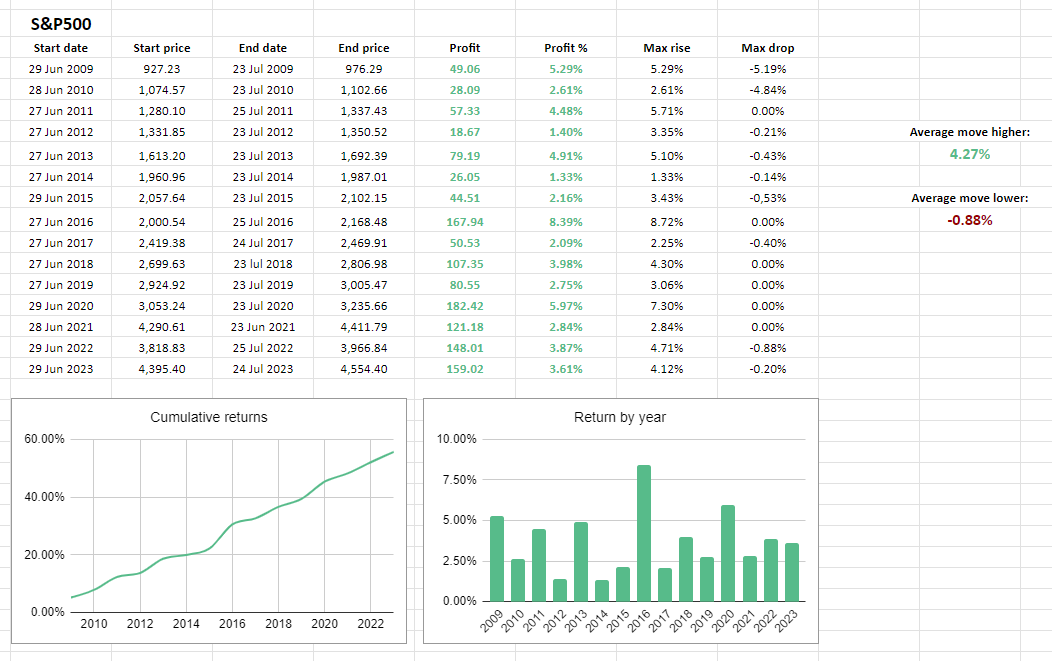
Over the past 15 years, the S&P500 has been up every single year between June 27 and July 24. Yes, you read that correctly!
Not… “most years”.
Not… “about half the time”.
No!
Every single year.
These kind of patterns are the ones that usually make traders (and investors) sit up, listen, and take notes of it. Seriously.
Here’s the exact data to back it up:
Ok.
Hold on a second!
And let me get this straight.
You are telling me that there is a specific timerange in which an asset for 15 years has been going in the same exact direction every single year?
Yes.
That’s what history shows.
Ok…
Is that random?
Maybe, maybe not.
Is that useful to know?
Absolutely!
It’s there, and it’s important information.
So what professional traders do with seasonality?
They use it to their advantage!
So, if history shows that the S&P500 (for whatever reason) likes to take a nice little hop in early July, what’s the smart play to do in that period?
Stay long. Go long. Or at least… AVOID shorts.
Makes sense?!
Perfect.
So how did the S&P500 performed in July this year?

It followed the seasonal pattern perfectly.
But let’s take another example…
Let’s change asset.
And let’s get fancier.
What about Bitcoin?!
Does seasonality work there too?
Yes!
Here’s just one example:

Above you can see how BTC has performed in October for the past 10 years.
Looks like there is some sort of pattern there, isn’t it?
Yes, and it’s bullish!
So what would be the smart trade on Bitcoin in October?
Long, of course!
That’s seasonality.
But let’s be practical…
Here’s how Bitcoin performed this year in that exact period:
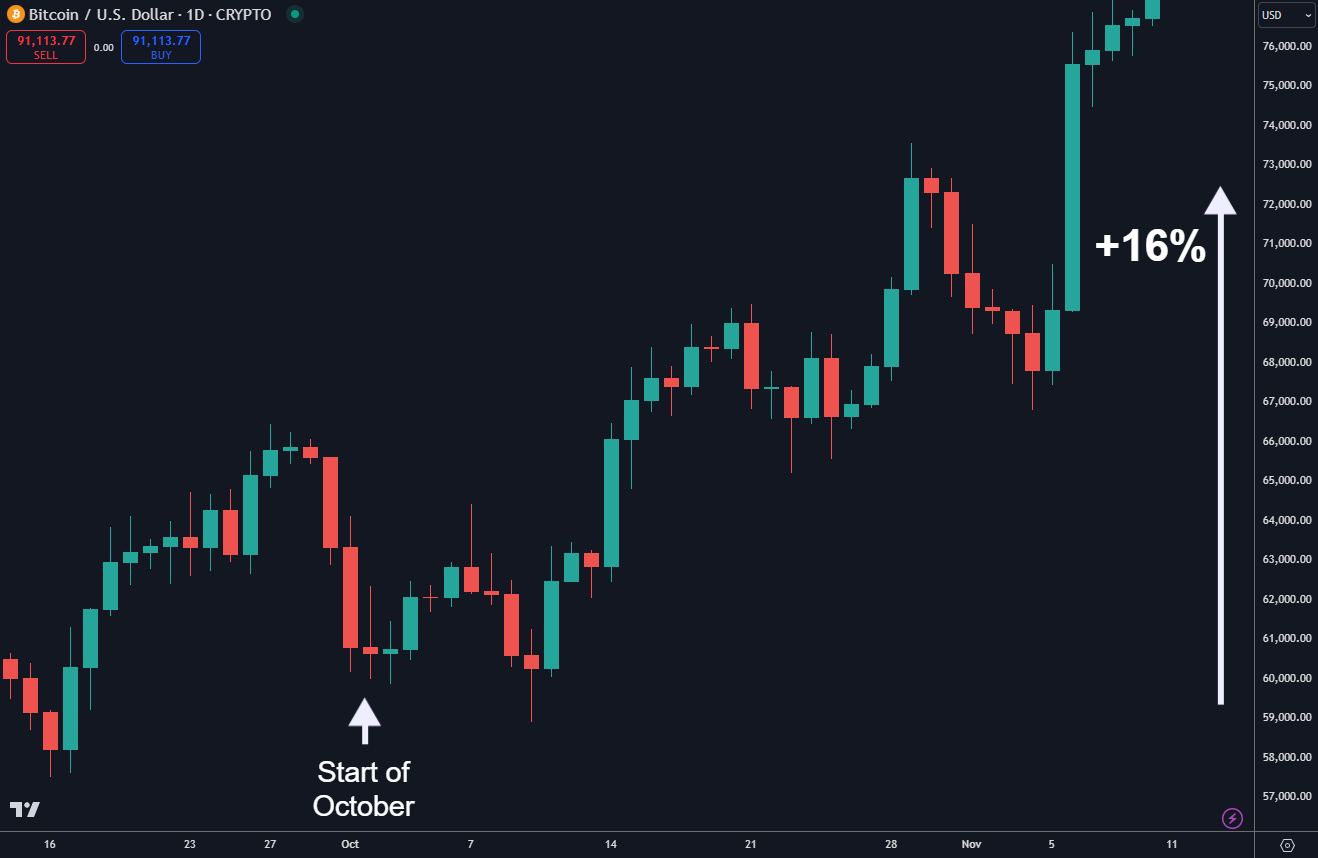
Can you spot why this is useful?
I’m sure you get the point.
But hold on a second…
Is this all theory? All hindsight stuff?!
No, not at all.
I shared this exact seasonal pattern in advance in early October.
This is practical and actionable stuff for traders.
Use seasonality as a strategic edge:
In simple…
Seasonality gives you a genuine edge.
Not something based on some random chart pattern that someone backtested for a couple of days and thought it was worth sharing.
No!
It’s something that has always been in the market.
And that‘s’ backed by (real) data, years of it.
Literally…
By incorporating seasonality into your strategies you add that bit of extra confluence that does make the difference.
Now, don’t get me wrong!
Seasonality is NOT bulletproof.
In this article I’ve given you clean and obvious examples.
But seasonal patterns work until they don’t.
So, simply…
Use the information as confluence for your trading.
Think of it like this:
You’re bullish on the S&P500 based on the overall macroeconomic context.
Maybe because of earnings, maybe because of interest rates.
Or maybe just a simple technical setup on the chart.
Whatever!
Simply your analysis is telling to be bullish…
On top of that, you look at the seasonal chart, and you see that price tends to move up (more often than not) over the next couple of weeks.
In other words, seasonality agrees with your analysis.
Cool, right?!
That’s what we call…
Confluence.
Why is that powerful?
Because you align your (subjective) analysis with a historical (objective) seasonal pattern. And that can make a difference in your consistency.
That’s all there is to say about it.
Now, I’ve got a question for you…
Would you like an article where we list all the most popular seasonal patterns that you need to be aware of?
One by one with data and statistics to back it up, of course 😉
Let me know your thoughts on it.


