
In partnership with

Big Tech Has Spent Billions Acquiring AI Smart Home Startups

The pattern is clear: when innovative companies successfully integrate AI into everyday products, tech giants pay billions to acquire them.
Google paid $3.2B for Nest.
Amazon spent $1.2B on Ring.
Generac spent $770M on EcoBee.
Now, a new AI-powered smart home company is following their exact path to acquisition—but is still available to everyday investors at just $1.90 per share.
With proprietary technology that connects window coverings to all major AI ecosystems, this startup has achieved what big tech wants most: seamless AI integration into daily home life.
Over 10 patents, 200% year-over-year growth, and a forecast to 5x revenue this year — this company is moving fast to seize the smart home opportunity.
The acquisition pattern is predictable. The opportunity to get in before it happens is not.
Past performance is not indicative of future results. Email may contain forward-looking statements. See US Offering for details. Informational purposes only.
🚀 Your Investing Journey Just Got Better: Premium Subscriptions Are Here! 🚀
It’s been 4 months since we launched our premium subscription plans at GuruFinance Insights, and the results have been phenomenal! Now, we’re making it even better for you to take your investing game to the next level. Whether you’re just starting out or you’re a seasoned trader, our updated plans are designed to give you the tools, insights, and support you need to succeed.
Here’s what you’ll get as a premium member:
Exclusive Trading Strategies: Unlock proven methods to maximize your returns.
In-Depth Research Analysis: Stay ahead with insights from the latest market trends.
Ad-Free Experience: Focus on what matters most—your investments.
Monthly AMA Sessions: Get your questions answered by top industry experts.
Coding Tutorials: Learn how to automate your trading strategies like a pro.
Masterclasses & One-on-One Consultations: Elevate your skills with personalized guidance.
Our three tailored plans—Starter Investor, Pro Trader, and Elite Investor—are designed to fit your unique needs and goals. Whether you’re looking for foundational tools or advanced strategies, we’ve got you covered.
Don’t wait any longer to transform your investment strategy. The last 4 months have shown just how powerful these tools can be—now it’s your turn to experience the difference.
Liquidity drives the markets — plain and simple. It’s the force behind every price jump, dip, or stall. But here’s the catch: if you don’t know where liquidity hides, you’re guessing your way through trades. Two concepts — Internal Range Liquidity (IRL) and External Range Liquidity (ERL) — changed how I see charts. Once I got these down, I started spotting moves before they happened. Let me walk you through it, step by step, with some practical tricks I’ve picked up over the years.
What’s IRL and ERL All About?
Think of liquidity as a pile of buy and sell orders waiting to get triggered. IRL and ERL are just ways to map out where those piles sit.
IRL (Internal Range Liquidity): This is the stuff inside a price range — like little pockets where orders stack up. When price swings by, it often bounces or hesitates there.
ERL (External Range Liquidity): This is outside the range, at the big highs and lows. These spots pull price like a magnet, setting up breakouts or reversals.
I used to trade without caring about this. Big mistake. Now, I lean on IRL and ERL to figure out where the action’s brewing. Let’s dig into each one.
Pay No Interest Until Nearly 2027 AND Earn 5% Cash Back
Use a 0% intro APR card to pay off debt.
Transfer your balance and avoid interest charges.
This top card offers 0% APR into 2027 + 5% cash back!
IRL: The Inside Scoop
Internal Range Liquidity is all about those sneaky zones within a price range. They’re packed with pending orders, and when price rolls through, something usually happens — maybe a quick reversal, maybe a pause. Here’s what I look for:
Order Blocks: Big players drop their orders here. I picture them as a wall of buy or sell tickets waiting to get punched.
Breaker Blocks: These pop up after price smashes through support or resistance, then swings back to test it. That broken level? It’s now a hotspot.
Fair Value Gaps (FVGs): Ever see price leap up fast, leaving a blank spot on the chart? That’s an FVG — orders left hanging, ready to snag price later.
Why It’s a Game-Changer
IRL is where the market tidies up loose ends. I’ve watched price hit an order block at $20, reverse, and climb to $22 more times than I can count. It’s not random — it’s orders getting filled.
A Quick Trick with Code
I’m no coder, but I messed around with Python to spot these zones. Here’s something I scratched together to find a peak (like an order block):
import matplotlib.pyplot as plt

# Simulated price data
price_data = [100, 101, 102, 103, 100, 99, 98, 101, 102, 103]
indices = list(range(len(price_data)))

# Define an order block detection function
def find_order_block(prices):
    for i in range(1, len(prices) - 1):
        if prices[i] > prices[i - 1] and prices[i] > prices[i + 1]:  # Local peak condition
            return prices[i], i
    return None, None

# Find the order block
peak, index = find_order_block(price_data)

# Plot the price data
plt.figure(figsize=(8, 5))
plt.plot(indices, price_data, marker='o', linestyle='-', label='Price Data', color='blue')

# Highlight the detected order block
if peak is not None:
    plt.scatter(index, peak, color='red', label=f'Order Block ({peak})', zorder=3, s=100)
    plt.annotate(f'OB: {peak}', (index, peak), textcoords="offset points", xytext=(-10,10), ha='center')

# Formatting the plot
plt.xlabel('Index')
plt.ylabel('Price')
plt.title('Order Block Detection in Price Data')
plt.legend()
plt.grid(True)

# Show the plot
plt.show()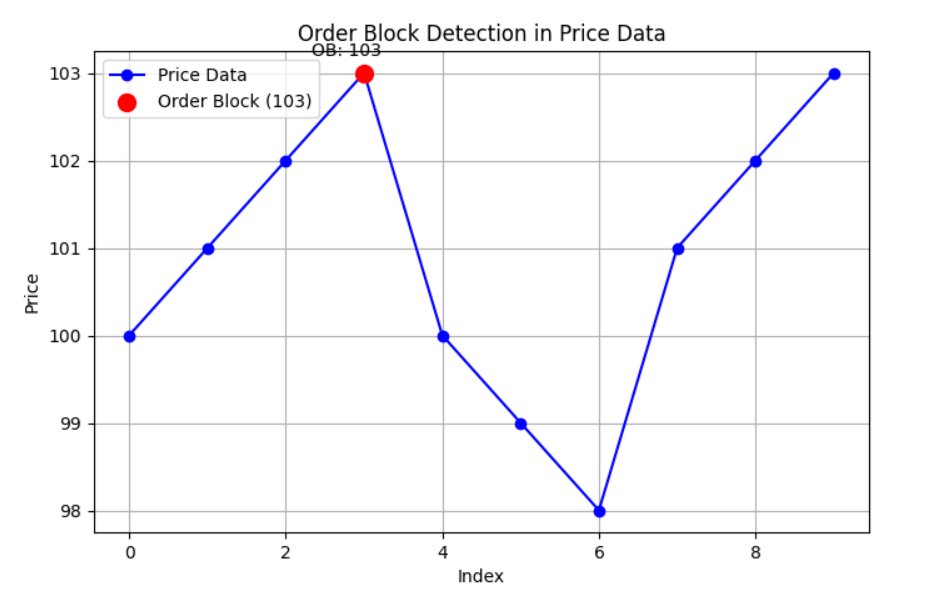
Running this flags 13 as a peak. In real life, I’d tweak it with actual chart data, but you get the gist.
ERL: The Outside Edge
External Range Liquidity is different — it’s the wild territory beyond the range. I’m talking swing highs and lows, those mountain peaks and valleys on your chart. They’re gold for setting stops and targets. Here’s the breakdown:
Swing Highs: The top of a climb before price tumbles. Tons of stop losses pile up here from buyers who got in too late.
Swing Lows: The bottom before a bounce. Sellers’ stops cluster here, ripe for the picking.
The Protected Zone Hack
Here’s something I learned the hard way: if price spikes past a swing high — say, $50 — triggers stops, and drops, that $50 turns into a “protected zone.” The market rarely comes back to mess with it again soon. It’s like the liquidity got vacuumed up.
Why It’s Worth Watching
ERL is where price hunts for fuel. I set my take-profit near a swing high once, and bam — price hit it and flipped. Knowing these spots keeps your trades sharp.
Another Code Experiment
I fiddled with this to catch a swing high:
import matplotlib.pyplot as plt

# Same price data
price_data = [100, 101, 102, 103, 100, 99, 98, 101, 102, 103]

# Detect a swing high
def find_swing_high(prices):
    for i in range(1, len(prices) - 1):
        if prices[i] > max(prices[i - 1], prices[i + 1]):
            return prices[i], i
    return None, None

swing_high, index = find_swing_high(price_data)

# Plot the price data
plt.figure(figsize=(8, 5))
plt.plot(price_data, marker='o', linestyle='-', color='blue', label='Price')

# Highlight the swing high point
if swing_high is not None:
    plt.scatter(index, swing_high, color='red', s=100, label='Swing High', edgecolors='black')

# Add labels and title
plt.xlabel('Index')
plt.ylabel('Price')
plt.title('Swing High Detection')
plt.legend()
plt.grid(True)

# Show the plot
plt.show()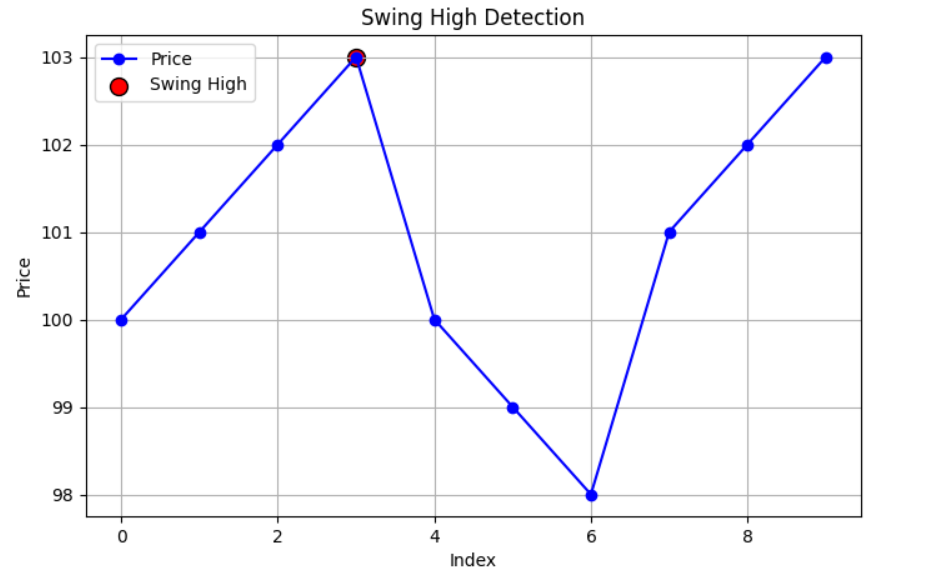
It spits out 13 again — a spot where price peaked. Crude, but it’s how I started piecing this together.
Examples
Let’s make this concrete.
IRL at Work: I was tracking a crypto pair stuck between $100 and $110. Noticed a Fair Value Gap at $105 — price had skipped it earlier. Sure enough, when it dipped back to $105, it stalled, then shot to $108. Orders got scooped up.
ERL in Play: Same pair later broke $110 and hit a swing high at $115. It crashed after, but on the next run-up, it stopped at $114. That $115 sweep made it a protected zone — price didn’t dare touch it again.
Why This Clicks
Once IRL and ERL clicked for me, trading felt less like a coin flip. I use IRL to time entries — like jumping in near a breaker block. ERL helps me pick targets and stops that actually make sense. It’s not foolproof, but it’s way better than eyeballing a chart.
Next time you’re staring at price action, hunt for those order blocks or swing lows. Play with some code if you’re nerdy like me. You’ll start seeing the market’s rhythm.
That’s my take — hope it sparks something for you!
Disclaimer: For educational purposes only: If you’re seeking a fully developed, ready-to-use trading system, this article won’t fulfill that expectation. However, if you’re interested in exploring ideas for further development, you’ll find valuable insights here.