
In partnership with

The Supply Chain Crisis Is Escalating — But This Tech Startup Keeps Winning

Global supply chain chaos is intensifying. Major retailers warn of holiday shortages, and tech giants are slashing forecasts as parts dry up.
But while others scramble, one smart home innovator is thriving.
Their strategic move to manufacturing outside China has kept production running smoothly — driving 200% year-over-year growth, even as the industry stalls.
This foresight is no accident. The same leadership team that saw the supply chain storm coming has already expanded into over 120 BestBuy locations, with talks underway to add Walmart and Home Depot.
At just $1.90 per share, this resilient tech startup offers rare stability in uncertain times. As investors flee vulnerable companies, this window is closing fast.
Past performance is not indicative of future results. Email may contain forward-looking statements. See US Offering for details. Informational purposes only.
🚀 Your Investing Journey Just Got Better: Premium Subscriptions Are Here! 🚀
It’s been 4 months since we launched our premium subscription plans at GuruFinance Insights, and the results have been phenomenal! Now, we’re making it even better for you to take your investing game to the next level. Whether you’re just starting out or you’re a seasoned trader, our updated plans are designed to give you the tools, insights, and support you need to succeed.
Here’s what you’ll get as a premium member:
Exclusive Trading Strategies: Unlock proven methods to maximize your returns.
In-Depth Research Analysis: Stay ahead with insights from the latest market trends.
Ad-Free Experience: Focus on what matters most—your investments.
Monthly AMA Sessions: Get your questions answered by top industry experts.
Coding Tutorials: Learn how to automate your trading strategies like a pro.
Masterclasses & One-on-One Consultations: Elevate your skills with personalized guidance.
Our three tailored plans—Starter Investor, Pro Trader, and Elite Investor—are designed to fit your unique needs and goals. Whether you’re looking for foundational tools or advanced strategies, we’ve got you covered.
Don’t wait any longer to transform your investment strategy. The last 4 months have shown just how powerful these tools can be—now it’s your turn to experience the difference.
The Triple Barrier Method, described by Marco Lopez de Prado in Advances in Financial Machine Learning, is a powerful technique for labeling events based on price movements. It mirrors real-world trading, where take-profits and stop-losses influence decisions — even implicitly, as in the case of margin calls. By defining three barriers — an upper barrier (profit-taking level), a lower barrier (stop-loss level), and a vertical barrier (time-based exit) — this method provides a structured framework for identifying meaningful price actions.
In this blog post, we’ll explore the intuition behind the method and demonstrate its implementation in Python for tick-level data. Note: This data will likely not fit in memory, but we’ll cover strategies for handling such large datasets in a future post. I personally use a custom + Dask solution which I can cover if enough people are interested.
How It Works
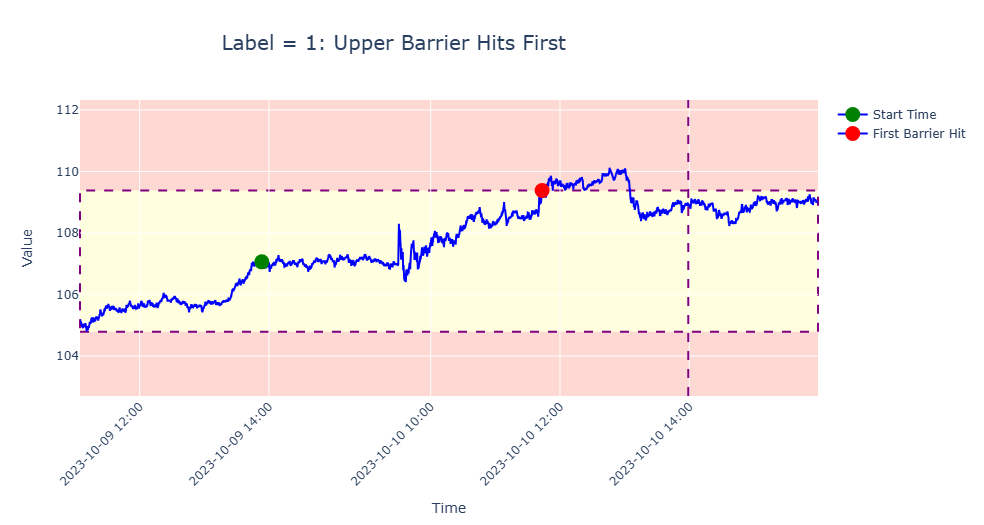
Upper Barrier:
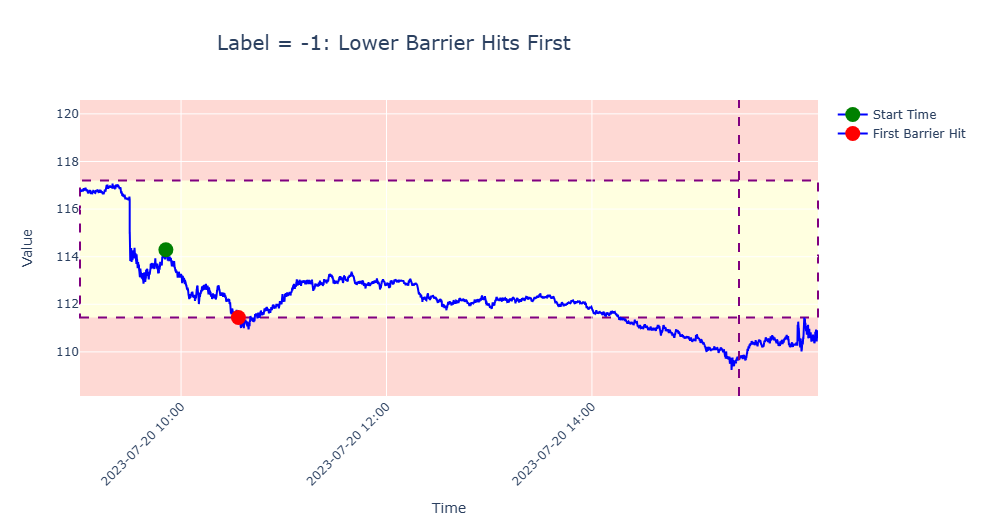
Set above the initial price. If the price hits this level first, the label is 1.Lower Barrier:
Set below the initial price. If the price hits this level first, the label is -1.Vertical Barrier:
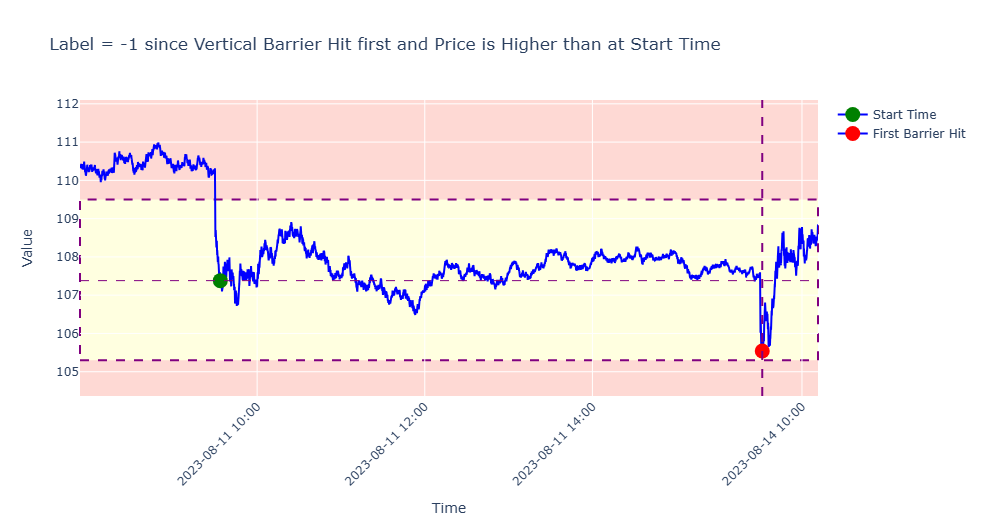
If neither horizontal barrier is reached within a predefined time frame, the label depends on the price at the exit:
1 if the exit price is above the event’s start price.
-1 if the exit price is at or below the event’s start price.
(Alternative: Some use a neutral label (0) for time-based exits but assigning 1 or -1 and incorporating sample weights often yields better results, as we’ll discuss in a later post.)
Pay No Interest Until Nearly 2027 AND Earn 5% Cash Back
Some credit cards can help you get out of debt faster with a 0% intro APR on balance transfers. Transfer your balance, pay it down interest-free, and save money. FinanceBuzz reviewed top cards and found the best options—one even offers 0% APR into 2027 + 5% cash back!
Examples
Setting Barrier Widths
Vertical Barrier
The vertical barrier is a time-based exit. While Lopez de Prado suggests setting it a fixed number of days after the event, this approach doesn’t account for nuances like business days, half-days, or specific trading hours. A better alternative is to define it as a fixed number of bars (e.g., volume bars, time bars, or dollar bars). For instance:
Set the vertical barrier to 50 bars after the event’s start time.
Horizontal Barriers
Horizontal barriers depend on price volatility. A common approach is to compute a rolling exponential weighted standard deviation (EWMA) of log returns over a fixed period. For example:
Calculate the EWMA standard deviation, σₜ, of 50-period log returns with a 100-bar window.
Compute barriers:
Upper Barrier: Pₜ⋅exp(C⋅σₜ)
Lower Barrier: Pₜ⋅exp(-Cσₜ)
where Pₜ is the current price and C is a configurable constant to control barrier width
Python Implementation
Assume we have dollar bars in a dataframe df_dollar_bars and trade level data in a dataframe df with columns Price, Size and index timestamp.
Add Barriers to Dollar Bars
C = 1
df_dollar_bars['Close_shift']=df_dollar_bars.Close.shift(50)
df_dollar_bars['Vertical_Barrier_TS']=df_dollar_bars.START_TS.shift(-50)
df_dollar_bars['std']=np.log(df_dollar_bars['Close']/df_dollar_bars['Close_shift']).ewm(100,min_periods=100).std()
df_dollar_bars['Upper_Barrier']=df_dollar_bars['Close']*np.exp(C*df_dollar_bars['std'])
df_dollar_bars['Lower_Barrier']=df_dollar_bars['Close']*np.exp(-C*df_dollar_bars['std'])
Label Events
def get_labels(df,dollar_bars,events):
    dollar_bars_events = dollar_bars.loc[events]
    first_barrier_touch_times = []
    for index,row in dollar_bars_events.iterrows():
        vertical_barrier = row['Vertical_Barrier_TS']
        prices =  df.loc[index:vertical_barrier].price
        upper_barrier_first_touch=prices[prices>row['Upper_Barrier']].index.min()
        lower_barrier_first_touch=prices[prices<row['Lower_Barrier']].index.min()
        first_barrier_touch_time=pd.Series([upper_barrier_first_touch,lower_barrier_first_touch,vertical_barrier]).min()
        first_barrier_touch_times.append(first_barrier_touch_time)
    labels = [1 if df.price[end].min()>df.price[start].min() else -1 for start,end in zip(events,first_barrier_touch_times)]
    return labels

labels = get_labels(df,df_dollar_bars,cusum_events)
References
De Prado, M.L. Advances in Financial Machine Learning. Wiley, 2018. Chapter 3 introduces the concept of the Triple Barrier Method and its use in labeling financial data.
GitHub Repository: Explore implementations at Hudson & Thames ML Finlab.
Research Article: Lopez de Prado, M.L. (2018). “The Triple Barrier Method for Labeling.” Available via SSRN: https://ssrn.com/abstract=3328466.