
In partnership with
In partnership with

Today’s Fastest Growing Company Might Surprise You

🚨 No, it's not the publicly traded tech giant you might expect… Meet $MODE, the disruptor turning phones into potential income generators.
Mode saw 32,481% revenue growth, ranking them the #1 software company on Deloitte’s 2023 fastest-growing companies list.
📲 They’re pioneering "Privatized Universal Basic Income" powered by technology — not government, and their EarnPhone has already helped consumers earn over $325M!
Invest in their pre-IPO offering before their share price changes on May 1st.
*An intent to IPO is no guarantee that an actual IPO will occur. Please read the offering circular and related risks at invest.modemobile.com.
*The Deloitte rankings are based on submitted applications and public company database research.
🚀 Your Investing Journey Just Got Better: Premium Subscriptions Are Here! 🚀
It’s been 4 months since we launched our premium subscription plans at GuruFinance Insights, and the results have been phenomenal! Now, we’re making it even better for you to take your investing game to the next level. Whether you’re just starting out or you’re a seasoned trader, our updated plans are designed to give you the tools, insights, and support you need to succeed.
Here’s what you’ll get as a premium member:
Exclusive Trading Strategies: Unlock proven methods to maximize your returns.
In-Depth Research Analysis: Stay ahead with insights from the latest market trends.
Ad-Free Experience: Focus on what matters most—your investments.
Monthly AMA Sessions: Get your questions answered by top industry experts.
Coding Tutorials: Learn how to automate your trading strategies like a pro.
Masterclasses & One-on-One Consultations: Elevate your skills with personalized guidance.
Our three tailored plans—Starter Investor, Pro Trader, and Elite Investor—are designed to fit your unique needs and goals. Whether you’re looking for foundational tools or advanced strategies, we’ve got you covered.
Don’t wait any longer to transform your investment strategy. The last 4 months have shown just how powerful these tools can be—now it’s your turn to experience the difference.

Financial markets are dynamic, with prices constantly moving. This activity creates a complex picture, often filled with “noise” — minor fluctuations that can obscure the underlying direction and significant turning points. Technical analysts use various tools to filter this noise and gain clarity. The Zig Zag indicator is one such tool, designed to highlight significant price swings by ignoring smaller movements.
This article delves into a Python script that automates the process of applying the Zig Zag indicator. We’ll explore how it uses libraries like yfinance, pandas, numpy, and mplfinance to fetch data, calculate Zig Zag points, and plot them onto a clear candlestick chart. We will break down the code with snippets and explain the Zig Zag indicator conceptually and its practical applications.
1. Understanding the Zig Zag Indicator
What it is: The Zig Zag indicator is primarily a trend filtering tool. It doesn’t predict future prices but rather helps simplify past price action by connecting significant peaks (highs) and troughs (lows) on a chart.
How it works (Conceptually): Imagine drawing lines on a price chart, but only changing direction when the price moves significantly against the current trend. The Zig Zag indicator does this by establishing a minimum price movement threshold (often a percentage, but sometimes fixed points).
It identifies potential peaks and troughs as the price moves.
A potential peak is only confirmed after the price drops by more than the predefined threshold from that peak.
A potential trough is only confirmed after the price rises by more than the predefined threshold from that trough.
It only plots these confirmed, significant turning points, effectively filtering out price movements smaller than the threshold.
You Don’t Need to Be Technical. Just Informed

AI isn’t optional anymore—but coding isn’t required.
The AI Report gives business leaders the edge with daily insights, use cases, and implementation guides across ops, sales, and strategy.
Trusted by professionals at Google, OpenAI, and Microsoft.
👉 Get the newsletter and make smarter AI decisions.
Key Parameter: The reversal threshold (represented as sigma in our script) is crucial.
A small threshold (e.g., 1%) will make the indicator very sensitive, resulting in many zig-zags, capturing smaller swings but potentially including more noise.
A large threshold (e.g., 10%) will filter aggressively, showing only major trend reversals and ignoring moderate swings.
Visual Representation: Typically, it’s drawn as a series of straight lines connecting alternating, confirmed peaks and troughs directly on the price chart. Our script focuses on marking the peak/trough points themselves.
2. Why Use the Zig Zag Indicator? (Usefulness)
The Zig Zag indicator is valuable for several analytical purposes:
Noise Reduction: Its primary benefit is simplifying complex price action, making it easier to discern the underlying trend by filtering out minor, insignificant fluctuations.
Identifying Support & Resistance: The troughs (bottoms) identified often correspond to significant support levels where buying interest previously emerged. The peaks (tops) often indicate resistance levels where selling pressure overcame buying.
Clearer Trend Definition: By showing sequences of higher highs and higher lows (uptrend) or lower highs and lower lows (downtrend) based on significant movements, it provides a cleaner picture of the dominant trend.
Chart Pattern Identification: The simplified lines or points can make classic chart patterns like Head and Shoulders, Double/Triple Tops and Bottoms, Flags, and Pennants much easier to spot.
Measuring Swing Magnitude: Allows analysts to easily measure the price distance or percentage change between significant market turns (the length of the “zig” or “zag”).
Aid for Elliott Wave Analysis: Some practitioners use Zig Zag to help identify potential wave counts according to Elliott Wave theory, as it simplifies the wave structure.
Important Note: The Zig Zag indicator is based on past data and requires a certain amount of price movement after a peak or trough to confirm it. Therefore, the most recent line segment or point is subject to change (repaint) until confirmed by a sufficient reversal. It’s an analytical tool, not typically used for generating direct entry/exit signals in isolation.
3. The Python Implementation: A Code Walkthrough
Let’s break down how the provided Python script implements the Zig Zag calculation and visualization.
3.1 Setting Up the Environment
The script starts by importing the necessary libraries and setting up basic logging:
Python
#!/usr/bin/env python3
import logging
from typing import List, Tuple, Optional # For type hinting

import matplotlib.pyplot as plt # Base plotting library
import mplfinance as mpf        # Financial charting
import numpy as np             # Numerical operations (arrays)
import pandas as pd            # Data manipulation (DataFrames)
import yfinance as yf          # Downloading market data
# --- Setup logging ---
logging.basicConfig(
    level=logging.INFO, # Set minimum level of messages to show
    format='[%(asctime)s] %(levelname)s: %(message)s' # Message format
)
This setup ensures all required tools are available and provides informative output during execution.
3.2 Fetching Market Data
The script fetches historical OHLC (Open, High, Low, Close) data using yfinance within the main execution block:
Python
if __name__ == '__main__':
    # --- Configuration for the run ---
    TICKER = 'BTC-USD'  # Example: Bitcoin USD
    PERIOD = '1mo'     # Example: Data for the last 1 month
                         # Other options: '1y', '6mo', '5d', 'max', etc.
    SIGMA = 0.03       # Example: 3% reversal threshold for Zig Zag

# --- Download Data ---
    logging.info(f"Downloading {TICKER} data for period: {PERIOD}")
    try:
        # Download data, progress=False hides the download status bar
        data = yf.download(TICKER, period=PERIOD, progress=False)
        if data.empty:
            raise ValueError(f"No data downloaded for {TICKER}.")
        # yfinance sometimes returns multi-level columns, flatten them
        # data.columns = data.columns.droplevel(1) # Adjusted to be optional/checked
        if isinstance(data.columns, pd.MultiIndex):
             data.columns = data.columns.droplevel(1)
        logging.info(f"Data downloaded successfully. Shape: {data.shape}")
    except Exception as e:
        logging.exception(f"Failed to download data for {TICKER}: {e}")
        exit() # Stop script if data download fails
    # ... (Calculation and Plotting calls follow) ...
Here, TICKER, PERIOD, and the crucial SIGMA are defined. The yf.download function retrieves the data into a pandas DataFrame, with basic error handling included.
3.3 The Core Calculation: find_zigzag_extremes
This function contains the algorithm described conceptually above.
Function Signature: Defines the inputs and output type.
Python
    def find_zigzag_extremes(
        high: np.ndarray,
        low: np.ndarray,
        close: np.ndarray,
        sigma: float
    ) -> pd.DataFrame:
        """ Docstring explaining function... """
        if len(close) < 2: # Need at least two points
             return pd.DataFrame(columns=['price', 'type', 'confirmation_idx'])
        # ... rest of the function ...
Initialization: Determines the initial trend based on the first two data points.
Python
    # Inside find_zigzag_extremes:
    # State variables initialization...
    last_extreme_type = 0
    up_trend = None
    # ... other variables ...

    # Initialize based on first two points trend
    if close[1] > close[0]:
        up_trend = True
        last_extreme_type = -1 # Implied previous bottom
        candidate_extreme_price = high[0]
        candidate_extreme_idx = 0
        last_confirmed_extreme_price = low[0] # Record initial point data
        last_confirmed_extreme_idx = 0
    else:
        up_trend = False
        last_extreme_type = 1 # Implied previous top
        candidate_extreme_price = low[0]
        candidate_extreme_idx = 0
        last_confirmed_extreme_price = high[0] # Record initial point data
        last_confirmed_extreme_idx = 0
Core Reversal Logic: The loop iterates through prices, updating candidates and checking for confirmations using
sigma.Python
    # Inside the loop `for i in range(1, len(close)):`

    # Example: Checking for Top Confirmation
    if up_trend: # Looking for a top
        if high[i] >= candidate_extreme_price:
            # New higher high found, update candidate top
            candidate_extreme_price = high[i]
            candidate_extreme_idx = i
        elif close[i] < candidate_extreme_price * (1 - sigma): # Price reversed > sigma%
            # Price reversed significantly, confirm the candidate top
            if last_extreme_type != 1: # Avoid confirming consecutive tops
                logging.debug(f"Idx {i}: Top confirmed: Idx={candidate_extreme_idx}, Price={candidate_extreme_price:.2f}...")
                extremes_data.append((candidate_extreme_idx, candidate_extreme_price, 1, i)) # Store confirmed top (type 1)
                last_extreme_type = 1
                last_confirmed_extreme_price = candidate_extreme_price
                last_confirmed_extreme_idx = candidate_extreme_idx
                # Start looking for a bottom
                up_trend = False
                candidate_extreme_price = low[i] # Initial candidate bottom
                candidate_extreme_idx = i
    else: # Looking for a bottom
        # Similar logic for finding lower lows and checking for upward reversal:
        # if low[i] <= candidate_extreme_price: ...
        # elif close[i] > candidate_extreme_price * (1 + sigma): ...
        #     if last_extreme_type != -1: ... # Confirm bottom (type -1)
            # ... update state, switch to looking for top ...
This section directly translates the Zig Zag concept: update the potential extreme until price reverses by more than
sigmapercent, then confirm and switch direction.Output DataFrame: Converts the collected list of extremes into a structured
pandas.DataFrame.Python
    # After the loop in find_zigzag_extremes:
    if not extremes_data:
        logging.warning("No significant extremes found...")
        return pd.DataFrame(columns=['price', 'type', 'confirmation_idx'])

    # Create DataFrame
    extremes_df = pd.DataFrame(
        extremes_data,
        columns=['extreme_idx', 'price', 'type', 'confirmation_idx']
    )
    extremes_df = extremes_df.set_index('extreme_idx') # Use bar number as index
    extremes_df = extremes_df.sort_index()
    # Remove duplicates if any (unlikely but safe)
    extremes_df = extremes_df[~extremes_df.index.duplicated(keep='last')]

    return extremes_df
3.4 Plotting the Results: plot_zigzag
This function visualizes the OHLC data and overlays the calculated Zig Zag points.
Preparing Marker Data: It creates lists aligned with the main OHLC data, placing the price (slightly offset) at the index of each extreme and
NaNelsewhere.Python
    # Inside plot_zigzag:
    tops_plot = [np.nan] * len(ohlc_data)
    bottoms_plot = [np.nan] * len(ohlc_data)
    marker_offset_factor = 0.01 # Small offset for visibility

    for idx, row in extremes.iterrows(): # Loop through confirmed extremes
         if idx < len(ohlc_data): # Check index bounds
             if row['type'] == 1: # Top
                 # Place marker slightly above the high
                 tops_plot[idx] = ohlc_data['High'].iloc[idx] * (1 + marker_offset_factor)
             elif row['type'] == -1: # Bottom
                 # Place marker slightly below the low
                 bottoms_plot[idx] = ohlc_data['Low'].iloc[idx] * (1 - marker_offset_factor)
Defining Added Plots:
mplfinance.make_addplotdefines how to draw the markers.Python
    # Inside plot_zigzag, after preparing tops_plot and bottoms_plot:
    apds = [ # List of addplot dictionaries
        mpf.make_addplot(tops_plot, type='scatter', marker='v', markersize=50, color='green', panel=0), # Tops
        mpf.make_addplot(bottoms_plot, type='scatter', marker='^', markersize=50, color='red', panel=0)   # Bottoms
    ]
Creating the Final Chart:
mplfinance.plotdraws the main chart and overlays the markers.Python
    # End of plot_zigzag function:
    mpf.plot(ohlc_data, # Main OHLC data
             type='candle', # Candlestick chart
             style='yahoo', # Visual style
             title=title,
             ylabel='Price',
             volume='Volume' in ohlc_data.columns, # Show volume panel if data exists
             addplot=apds, # Overlay the scatter markers for extremes
             figsize=(10, 6) # Suggested figure size
            )
3.5 Running the Script
The if __name__ == '__main__': block ties everything together:
Python
if __name__ == '__main__':
    # --- Configuration ---
    TICKER = 'BTC-USD'
    PERIOD = '1mo'
    SIGMA = 0.03

    # --- Download Data ---
    # (Code shown previously)
    data = yf.download(...)

    # --- Calculate Extremes ---
    logging.info(f"Calculating Zigzag extremes with sigma={SIGMA:.2%}")
    extremes_df = find_zigzag_extremes(
        data['High'].to_numpy(), # Pass price arrays
        data['Low'].to_numpy(),
        data['Close'].to_numpy(),
        SIGMA
    )

    # --- Plot Results ---
    if not extremes_df.empty:
        logging.info(f"Found {len(extremes_df)} extremes.")
        logging.info("Generating plot...")
        plot_title = f"{TICKER} Price with Zigzag Extremes (Sigma={SIGMA:.1%})"
        plot_zigzag(data, extremes_df, plot_title) # Call plotting function
        logging.info("Plot generation complete.")
    else:
        logging.warning("No extremes found to plot.")
        # Optionally plot just price data
        mpf.plot(data, type='candle', title=f"{TICKER} Price Data (No Extremes Found)", ...)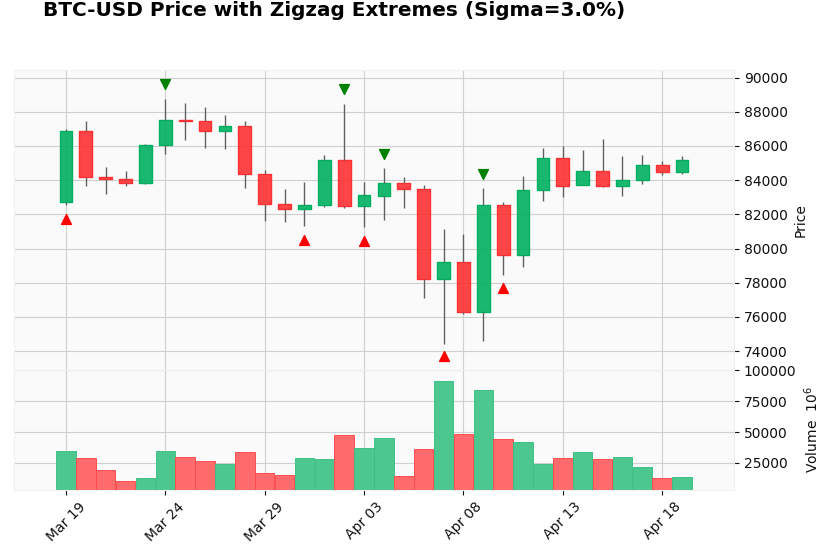
This structure makes the script runnable, executing the download, calculation, and plotting steps sequentially.
4. Putting It Together: Example Interpretation
If you run this script with TICKER='BTC-USD', PERIOD='1mo', and SIGMA=0.03, it will:
Download the last month of Bitcoin/USD price data.
Calculate significant turning points where the price reversed by at least 3%.
Display a candlestick chart for that month.
Overlay red upward triangles (
^) at the identified significant bottoms (potential support).Overlay green downward triangles (
v) at the identified significant tops (potential resistance).
By observing the sequence and levels of these markers, an analyst can quickly grasp the major swings and potential support/resistance areas within that period according to the 3% Zig Zag criterion.
Conclusion
This Python script provides a practical and automated way to apply the Zig Zag indicator to financial data. It leverages powerful libraries to handle data acquisition, calculation, and visualization efficiently. Understanding both the conceptual basis of the Zig Zag indicator — its role in filtering noise and highlighting significant reversals — and the script’s implementation allows users to effectively utilize this tool for clearer market analysis, trend assessment, and pattern recognition. Remember to choose the sigma value carefully based on the asset's volatility and the desired level of sensitivity.