Stay Ahead of the Market
Markets move fast. Reading this makes you faster.
Every weekday, you’ll get a 5-minute Elite Trade Club newsletter covering the top stories, market-moving headlines, and the hottest stocks — delivered before the opening bell.
Whether you’re a casual trader or serious investor, it’s everything you need to know before making your next move. Join 160k+ other investors who get their market news the smart and simple way.
🚀 Your Investing Journey Just Got Better: Premium Subscriptions Are Here! 🚀
It’s been 4 months since we launched our premium subscription plans at GuruFinance Insights, and the results have been phenomenal! Now, we’re making it even better for you to take your investing game to the next level. Whether you’re just starting out or you’re a seasoned trader, our updated plans are designed to give you the tools, insights, and support you need to succeed.
Here’s what you’ll get as a premium member:
Exclusive Trading Strategies: Unlock proven methods to maximize your returns.
In-Depth Research Analysis: Stay ahead with insights from the latest market trends.
Ad-Free Experience: Focus on what matters most—your investments.
Monthly AMA Sessions: Get your questions answered by top industry experts.
Coding Tutorials: Learn how to automate your trading strategies like a pro.
Masterclasses & One-on-One Consultations: Elevate your skills with personalized guidance.
Our three tailored plans—Starter Investor, Pro Trader, and Elite Investor—are designed to fit your unique needs and goals. Whether you’re looking for foundational tools or advanced strategies, we’ve got you covered.
Don’t wait any longer to transform your investment strategy. The last 4 months have shown just how powerful these tools can be—now it’s your turn to experience the difference.
In my last post, I played with a simple 2-day SMA strategy on TSLA and found surprisingly solid results.
But then came the inevitable comment:
Just add slippage and commission — and your results will probably turn negative.
Fair. So I did.
I add a basic slippage rate and trading fees — nothing extreme, just enough to mimic the real world.
Get Featured by Publishers Driving Holiday Amazon Sales
This holiday season, top publishers are hand-selecting Amazon brands for gift guides, newsletters, reviews, and more — sending high-intent shoppers directly to storefronts.
Levanta is partnering with these publishers to connect them with a select group of 7–9 figure brands ready to scale.
No Free Trades: Slippage and Fees in Practice
To reflect the realities of trading, I modified the SMA strategy to include basic cost factors:
Slippage, which accounts for imperfect execution prices
Commission, the fee per trade that eats into profits
These aren’t fancy models — just simple percentage — based adjustments. But even small frictions can change the picture fast.
Here’s the updated function:
import yfinance as yf
import numpy as np
import pandas as pd
import matplotlib.pyplot as plt

def sma_strategy_slippage_commission(df_org,window,slippage_rate,commission_rate,draw = True):
    df = df_org.copy()
    # Calculate SMA based on closing price
    df['SMA'] = df.rolling(window=window).mean().fillna(0)

    # Calculate execution price with slippage (assume buying slightly worse than close)
    df['ExecPrice'] = df[brand] * (1 - slippage_rate)

    # Generate signal using ideal (close) price
    df['Signal'] = (df[brand] < df['SMA']).astype(int)
    df['Position'] = df['Signal'].diff()

    # Buy and sell points using slippage-adjusted execution price
    df['Buy'] = (df['Position'] == 1).astype(int)*df['ExecPrice']
    df['Sell'] = (df['Position'] == -1).astype(int)*df['ExecPrice']

    # If there is a final unmatched Buy, we force-close it at the last available price
    if (df['Buy'] - df['Sell'] ).sum() > 0:
        df['Sell'].iat[-1] = df['ExecPrice'].iat[-1]

    # Compute commissions for each trade
    df['Buy_commission'] = df['Buy'] * commission_rate
    df['Sell_commission'] = df['Sell'] * commission_rate

    # Calculate profit net of slippage and commissions
    df['Profit'] = (df['Sell'] - df['Buy'] - df['Buy_commission'] - df['Sell_commission']).cumsum()
    df['Profit on sale'] = ((df['Sell'] > 0).astype(int)*df['Profit']).cumsum()

    if draw is True:
        fig,axs = plt.subplots(2,1,figsize=(14,8))
        ax = axs[0]
        ax.plot(df.index,df[brand],label = brand ,color='black')
        ax.plot(df.index[window:],df['SMA'][window:],label = 'SMA' ,color='grey')
        ax.scatter(df.index,(df['Buy']).replace(0,np.nan),label='Buy',color='blue')
        ax.scatter(df.index,(df['Sell']).replace(0,np.nan),label='Sell',color='red')
        ax.label_outer()
        ax.set_title('SMA Crossover Strategy: '+str(brand))
        ax.set_ylabel('Price')
        ax.grid()

        ax = axs[1]
        ax.plot(df.index,df['Profit on sale'])
        ax.set_ylabel('Pofit')
        ax.set_xlabel('Date')
        ax.grid()

    return df
Now that we have a version of the strategy that includes slippage and commission, it’s time to see how much impact they actually make.
I ran the same SMA backtest twice — once with trading costs, and once without — across different window size from 2 to 50.
Here’s the code for comparison:
dfs = []
for window in range(2,51):
    df = sma_strategy(df_org,window,False)
    dfs.append(df['Profit on sale'].to_frame(name=window))
result = pd.concat(dfs,axis=1)

x = result.columns.to_list()
y1 = result.iloc[-1,:]

dfs = []
for window in range(2,51):
    df = sma_strategy_slippage_commission(df_org,window,slippage_rate,commission_rate,False)
    dfs.append(df['Profit on sale'].to_frame(name=window))
result = pd.concat(dfs,axis=1)

y2 = result.iloc[-1,:]

fig,ax = plt.subplots()
ax.plot(x,y1,label='Without Slippage&Commission')
ax.plot(x,y2,label='With Slippage&Commission')
ax.set_xlabel('Window size')
ax.set_ylabel('Final profit on sale')
ax.set_title('SMA Crossover Strategy: '+str(brand))
plt.grid()
plt.legend()
How much impact they actually make
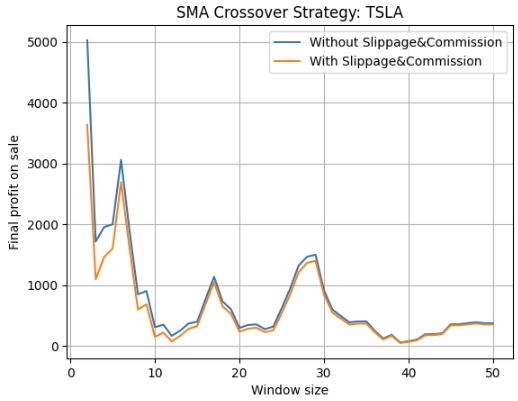
Here’s what the results look like. The difference isn’t massive — but it’s there.

Comparison of final profits across window sizes (with vs. without trading costs).Even small frictions leave their mark.
Despite the added friction, one thing didn’t change: The 2-day SMA still came out on top.
Not by a small margin, either. Even with slippage and fees, it delivered the strongest cumulative profit across all tested windows.
That was… unexpected.
Why Did it Still Work?
One possible reason is sheer trade frequency.
A 2-day SMA flips positions often-maybe too often in most markets. But with a volatile stock like TSLA, that hyper-reactive might actually help. It catches micro-trends, rides the short bursts, and exits before reversals hit too hard.
It’s not elegant. It’s not robust. But sometimes, brute force timing just work s— until it doesn’t.
Strategies like this aren7t bult to last forever. They ride a temporary edge — until the market adapts, volatility shifts, or friction overwhelms.
But that’s the point of backtesting.
For now, the 2-day SMA still stands. Next week? Who knows.


