
In partnership with

Start learning AI in 2025

Everyone talks about AI, but no one has the time to learn it. So, we found the easiest way to learn AI in as little time as possible: The Rundown AI.
It's a free AI newsletter that keeps you up-to-date on the latest AI news, and teaches you how to apply it in just 5 minutes a day.
Plus, complete the quiz after signing up and they’ll recommend the best AI tools, guides, and courses – tailored to your needs.
🚀 Your Investing Journey Just Got Better: Premium Subscriptions Are Here! 🚀
It’s been 4 months since we launched our premium subscription plans at GuruFinance Insights, and the results have been phenomenal! Now, we’re making it even better for you to take your investing game to the next level. Whether you’re just starting out or you’re a seasoned trader, our updated plans are designed to give you the tools, insights, and support you need to succeed.
Here’s what you’ll get as a premium member:
Exclusive Trading Strategies: Unlock proven methods to maximize your returns.
In-Depth Research Analysis: Stay ahead with insights from the latest market trends.
Ad-Free Experience: Focus on what matters most—your investments.
Monthly AMA Sessions: Get your questions answered by top industry experts.
Coding Tutorials: Learn how to automate your trading strategies like a pro.
Masterclasses & One-on-One Consultations: Elevate your skills with personalized guidance.
Our three tailored plans—Starter Investor, Pro Trader, and Elite Investor—are designed to fit your unique needs and goals. Whether you’re looking for foundational tools or advanced strategies, we’ve got you covered.
Don’t wait any longer to transform your investment strategy. The last 4 months have shown just how powerful these tools can be—now it’s your turn to experience the difference.

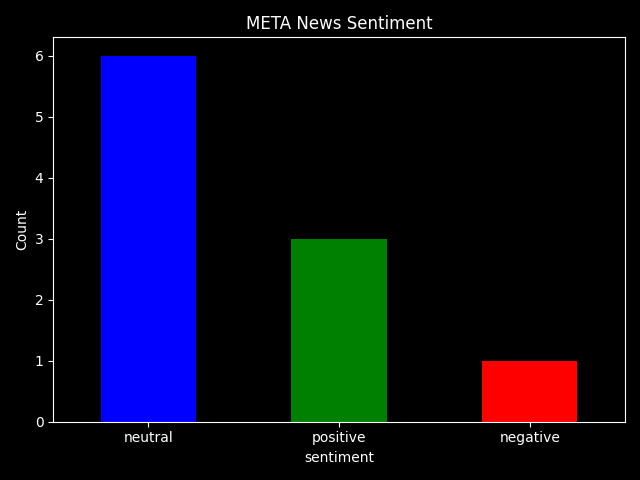
META Stock News Sentiment Analysis Chart
News plays a major role in how people and markets react to stocks. A single article or press release can cause a sharp change in stock price.
Understanding the sentiment behind financial news can help investors make better decisions.
In this article, I will show you how to build a simple sentiment analysis pipeline for stock-related news using FinBERT, a language model designed specifically for financial text.
We’ll use Python, the Hugging Face transformers library, and yfinance to collect news headlines and summaries. Then we'll classify each news summary as:
positive
negative or
neutral
Finally, we'll save and visualize the sentiment distribution.
Stay In The Business Know with 1440

Are you looking for easy breakdowns and knowledge deep dives on the latest key concepts to help you understand business and finance topics? Finance news doesn’t have to be confusing. 1440’s weekly newsletter explains markets, policy, and investing in plain English—complete with charts, context, and links to learn more.
What is FinBERT?
FinBERT is a version of the BERT model that has been fine-tuned on financial news articles. It was created by Prosus AI using the original BERT base model from Google.
Unlike general-purpose sentiment models, FinBERT is trained on financial language, which helps it understand domain-specific words and phrasing.
For example, a sentence like “profits decreased less than expected” may be seen as positive in financial contexts, even though it contains the word “decreased”.
FinBERT is designed to handle this kind of nuance.
Installing the Required Libraries
First, we need to install the necessary libraries. These include:
yfinancefor retrieving stock newstransformersandtorchfor working with FinBERTpandasfor handling datamatplotlibplotting results.
%pip install yfinance transformers torch pandas matplotlibThis cell ensures all dependencies are installed in your Python environment.
Importing Python Libraries
Once the libraries are installed, we import them into our workspace.
import pandas as pd
from transformers import pipeline, AutoTokenizer, AutoModelForSequenceClassification
import matplotlib.pyplot as plt
import yfinance as yf
plt.style.use("dark_background")
We import pandas to handle dataframes, matplotlib.pyplot for plotting, and several modules from transformers to load FinBERT.
yfinance is used to pull news related to a stock ticker.
Loading the FinBERT Model
Now we load the pre-trained FinBERT model and tokenizer.
# Load FinBERT for sentiment analysis
model_name = "ProsusAI/finbert"
tokenizer = AutoTokenizer.from_pretrained(model_name)
model = AutoModelForSequenceClassification.from_pretrained(model_name)
classifier = pipeline("sentiment-analysis", model=model, tokenizer=tokenizer)
We specify the model name ProsusAI/finbert, which is available on Hugging Face. We create a sentiment classification pipeline using this model and tokenizer.
The pipeline will handle tokenization and prediction for each input string.
Fetching News from Yahoo Finance
We now fetch the latest news articles for a stock of interest.
ticker = "META"  # Example ticker symbol
dat = yf.Ticker(ticker)
news = dat.news
We create a Ticker object for Meta Platforms Inc. (formerly Facebook) and use the .news attribute to access recent news headlines and summaries.
Preparing the News Data
We convert the news into a structured format using a dataframe.
# Extract 'content' part into a DataFrame
df = pd.DataFrame([item["content"] for item in news])

# Keep only desired columns
columns_to_keep = ['title', 'summary', 'pubDate']
df = df[columns_to_keep]

# Display result
df.head(100)
Each news item is stored as a dictionary. We extract the "content" part of each item and create a dataframe.
Then we keep only the columns we need:
the title,
summary,
and publication date.
Performing Sentiment Analysis
Now we apply FinBERT to each news summary.
df["sentiment"] = df["summary"].apply(lambda x: classifier(x)[0]['label'])
df["confidence"] = df["summary"].apply(lambda x: classifier(x)[0]['score'])

# Optional: Clean up label casing
df["sentiment"] = df["sentiment"].str.lower()
df.head()
We use the sentiment classifier to predict the sentiment of each summary. The .apply function runs the classifier on each row and extracts both the label and confidence score.
We also convert the sentiment labels to lowercase for consistency.
Saving the Results
We can now save the results to a CSV file for future analysis.
# Save to CSV
filename = f"{ticker}_news_sentiment.csv"
df.to_csv(filename, index=False)
print(f"Saved sentiment results to {filename}")
This cell creates a filename based on the stock ticker and writes the dataframe to a CSV file. The index=False argument ensures that row indices are not saved.
Visualizing the Sentiment Distribution
Finally, we visualize how many news items were classified as positive, neutral, or negative.
# Visualize sentiment
sentiment_counts = df["sentiment"].value_counts()
sentiment_counts.plot(kind="bar", title=f"{ticker} News Sentiment", color=["blue", "green", "red"])
plt.ylabel("Count")
plt.xticks(rotation=0)  # Set x-axis labels to horizontal
plt.tight_layout()      # Adjust layout to prevent clipping
plt.savefig(f"{ticker}_sentiment_counts.png")
plt.show()
META Stock News Sentiment Analysis Chart
We count how many times each sentiment label appears and use a bar chart to show the distribution. Green represents positive news, red represents negative, and gray is for neutral sentiment.
Subscribe to Starter Investor Plan to read the rest.
Become a paying subscriber of Starter Investor Plan to get access to this post and other subscriber-only content.
UpgradeA subscription gets you:
- Exclusive Trading Strategies: Access proven trading strategies used by me and my team.
- Research Insights: Get bi-weekly summaries of key research papers and strategies built upon them.
- Monthly Market Insights Newsletter: Stay informed with exclusive updates on market trends and analysis.