A W-2, a Laundromat Owner, & a Billionaire Walk Into a Room…
NOVEMBER 2-4 | AUSTIN, TX
At Main Street Over Wall Street 2025, you’ll learn the exact playbook we’ve used to help thousands of “normal” people find, fund, negotiate, and buy profitable businesses that cash flow.
Use code BHP500 to save $500 on your ticket today (this event WILL sell out).
Click here to get your ticket, see the speaker list, schedule, and more.
🚀 Your Investing Journey Just Got Better: Premium Subscriptions Are Here! 🚀
It’s been 4 months since we launched our premium subscription plans at GuruFinance Insights, and the results have been phenomenal! Now, we’re making it even better for you to take your investing game to the next level. Whether you’re just starting out or you’re a seasoned trader, our updated plans are designed to give you the tools, insights, and support you need to succeed.
Here’s what you’ll get as a premium member:
Exclusive Trading Strategies: Unlock proven methods to maximize your returns.
In-Depth Research Analysis: Stay ahead with insights from the latest market trends.
Ad-Free Experience: Focus on what matters most—your investments.
Monthly AMA Sessions: Get your questions answered by top industry experts.
Coding Tutorials: Learn how to automate your trading strategies like a pro.
Masterclasses & One-on-One Consultations: Elevate your skills with personalized guidance.
Our three tailored plans—Starter Investor, Pro Trader, and Elite Investor—are designed to fit your unique needs and goals. Whether you’re looking for foundational tools or advanced strategies, we’ve got you covered.
Don’t wait any longer to transform your investment strategy. The last 4 months have shown just how powerful these tools can be—now it’s your turn to experience the difference.
The Idea
A few days ago, I came across this piece by Sofien Kaabar on the “Internal Bar Strength” indicator, on his All About Trading! Substack.
Very simple concept using this indicator:
𝐼𝐵𝑆=(𝑐𝑙𝑜𝑠𝑒−𝑙𝑜𝑤)/(ℎ𝑖𝑔ℎ−𝑙𝑜𝑤)
With these simple trading rules: Long entry when IBS<0.2 and Exit when IBS>0.8
Results look pretty interesting in the TradingView platform. It looks like an interesting strategy to trade with US equity index futures, to avoid the “wash sales tax” when trading ETFs (for US citizens/residents, due to the higher trade frequency), and to reduce trading costs.
Analysis
Let’s expand Sofien’s analysis to a lot of markets, beyond S&P500, and check how it performs. Here’s a market universe of CSI Data symbols with categories by yours truly.
symbol.frame=data.frame(
  symbol=c('MES','MNQ','M2K' ,'MYM' ,'FNG',
           'A50','SIN','JTM',
           'FXP','FDX',
           'C2','W2','S2','SM2','BO2',
           'EMA','COM','BL2',
           'KC2','SB2','CT2','LB','LBR','CC2',
           'LCC','LRC','LSU',
           'GC2','SI2','PA2','PL2','HG2',
           'LC','LH', 'FC',
           'CL2','RB2','NG2','HO2',
           'VX','FVS',
           'EBL','TY'
           ),
category=c('US.EQ','US.EQ','US.EQ','US.EQ','US.EQ',
           'ASIA.EQ','ASIA.EQ','ASIA.EQ',
           'EUR.EQ', 'EUR.EQ',
           'US.GRAIN','US.GRAIN','US.GRAIN','US.GRAIN','US.GRAIN',
           'EUR.GRAIN','EUR.GRAIN','EUR.GRAIN',
           'US.SOFT' ,'US.SOFT', 'US.SOFT','US.SOFT','US.SOFT','US.SOFT',
           'EUR.SOFT','EUR.SOFT','EUR.SOFT',
           'US.METAL','US.METAL','US.METAL','US.METAL','US.METAL',
           'US.MEAT' ,'US.MEAT','US.MEAT',
           'US.ENERG','US.ENERG', 'US.ENERG','US.ENERG',
           'VOLA','VOLA',
           '10YBOND','10YBOND')
)
Now let’s compute performance for each market without compounding, and sizing by inverse volatility for apples-to-apples comparison; since each future has a different contract size and natural volatility. To see if we can find some patterns…
Wall Street Isn’t Warning You, But This Chart Might
Vanguard just projected public markets may return only 5% annually over the next decade. In a 2024 report, Goldman Sachs forecasted the S&P 500 may return just 3% annually for the same time frame—stats that put current valuations in the 7th percentile of history.
Translation? The gains we’ve seen over the past few years might not continue for quite a while.
Meanwhile, another asset class—almost entirely uncorrelated to the S&P 500 historically—has overall outpaced it for decades (1995-2024), according to Masterworks data.
Masterworks lets everyday investors invest in shares of multimillion-dollar artworks by legends like Banksy, Basquiat, and Picasso.
And they’re not just buying. They’re exiting—with net annualized returns like 17.6%, 17.8%, and 21.5% among their 23 sales.*
Wall Street won’t talk about this. But the wealthy already are. Shares in new offerings can sell quickly but…
*Past performance is not indicative of future returns. Important Reg A disclosures: masterworks.com/cd.
BA=fGetFuturesBA(symbol.frame$symbol)%>%
  inner_join(symbol.frame,by='symbol')%>%
  group_by(symbol)%>%
    arrange(date)%>%
    #Indicators
    mutate(
      annvola=roll_sd(log(close.r/lag(close.r)),30)*16*100,
      ibs=(close.p-low.p)/(high.p-low.p)
    )%>%
    #Signal
    mutate(signal=case_when(
      ibs<0.2 & lag(ibs)>=0.2 ~ 1,
      ibs>0.8 ~ 0,
      T ~ as.numeric(NA)
    ))%>%fill(signal)%>%mutate(signal=replace_na(signal,0))%>%
    #Sizing
    mutate(
           #Position sizing such that you lose 5% of account
           #when 7 standard deviation move against position
           size.c=0.05*fx*1e5/(fullpointvalue*7*(annvola/16/100)*close),
           size=case_when(
             signal & !lag(signal) ~ size.c,
             T ~ as.numeric(NA))
    )%>%fill(size)%>%mutate(size=replace_na(size,0))%>%
  ungroup()%>%
  mutate(
      strategy='Internal Bar Strength',
      allocation=1,
      ordertype='MKT'
  )
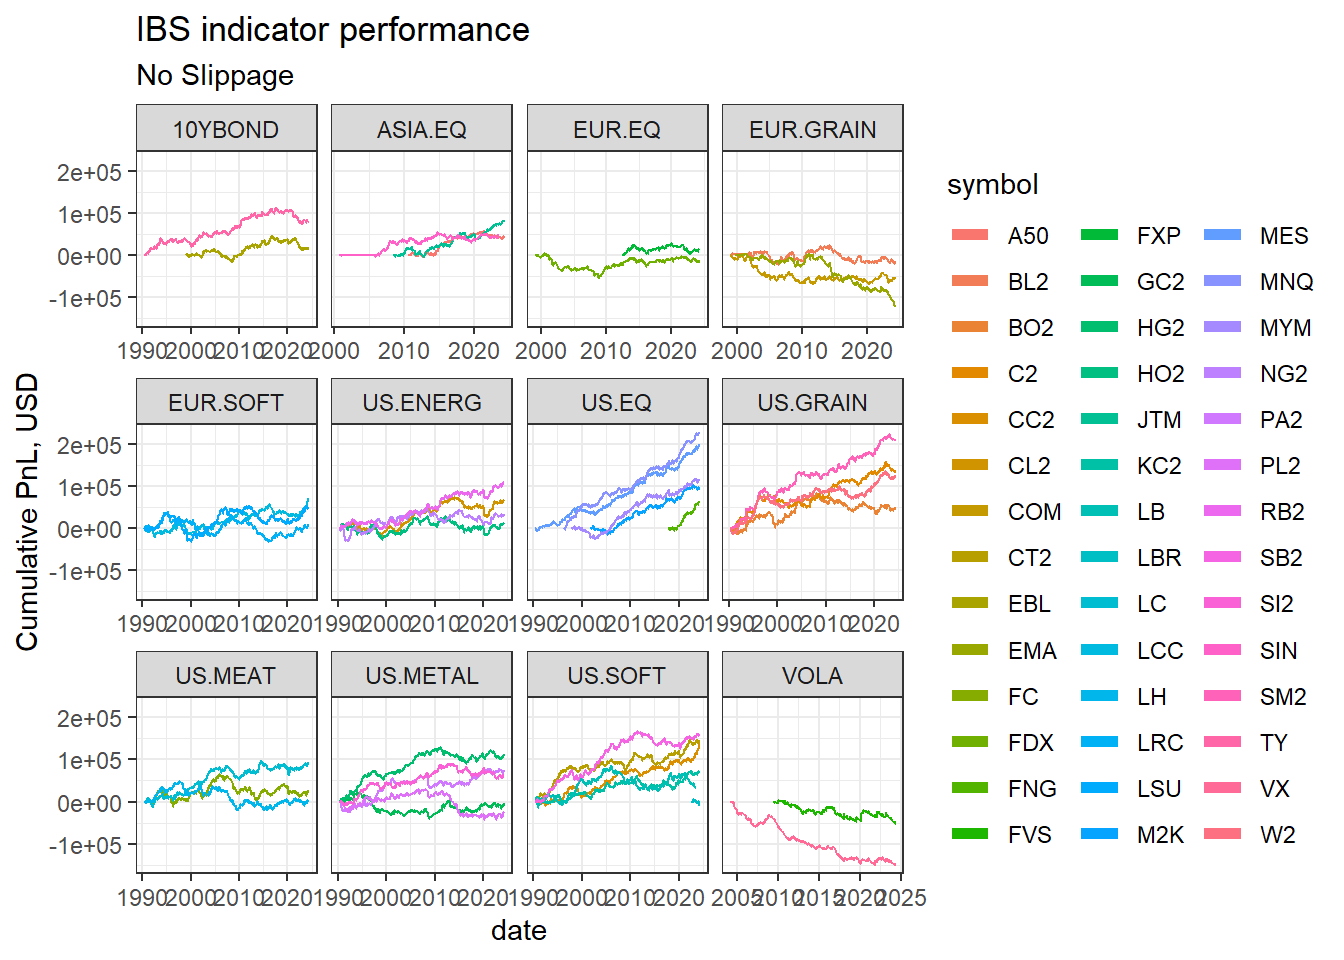
This is the IBS indicator performance with no slippage:
#No slippage
BA%>%
  fComputePnL(slippageTicks = 0)%>%
  mutate(symbol.cumpnl=symbolcumret-symbolcumcost)%>%
  ggplot(aes(x=date,y=symbol.cumpnl,color=symbol))+
    geom_step()+
    theme_bw() +
    ylab('Cumulative PnL, USD')+
    guides(color = guide_legend(override.aes = list(linewidth = 2))) +
    facet_wrap(~category,scales='free_x',ncol=4)+
    ggtitle('IBS indicator performance',subtitle = 'No Slippage')
This is the IBS indicator performance with 1 tick slippage:

This is the performance with 3 ticks slippage:

Interesting... Here are some observations:
The strategy is highly sensitive to slippage and liquidity, as expected since it is short term in nature.
There is edge in some other markets other than US equity indexes but it goes away when slippage is introduced.
An espresso shot for your brain
The problem with most business news? It’s too long, too boring, and way too complicated.
Morning Brew fixes all three. In five minutes or less, you’ll catch up on the business, finance, and tech stories that actually matter—written with clarity and just enough humor to keep things interesting.
It’s quick. It’s free. And it’s how over 4 million professionals start their day. Signing up takes less than 15 seconds—and if you’d rather stick with dense, jargon-packed business news, you can always unsubscribe.
It looks like this strategy would only work effectively in the highly liquid US index futures. Let’s do a backtest using a naïve 1/N position sizing (which performs better usually) to gauge the strategy performance:
Universe=symbol.frame%>%
  filter(category %in% c('US.EQ'))


BT=fGetFuturesBA(Universe$symbol)%>%
  inner_join(Universe,by='symbol')%>%
  filter(date>='2000-01-01')%>%
  #Get available market count
  fPadData()%>%
  group_by(date)%>%
    mutate(N=n())%>%
    filter(!gapfilled)%>%
  group_by(symbol)%>%
    arrange(date)%>%
    #Indicators
    mutate(
      annvola=roll_sd(log(close.r/lag(close.r)),30)*16*100,
      ibs=(close.p-low.p)/(high.p-low.p)
    )%>%
    #Signal
    mutate(signal=case_when(
      ibs<0.2 & lag(ibs)>=0.2 ~ 1,
      ibs>0.8 ~ 0,
      T ~ as.numeric(NA)
    ))%>%fill(signal)%>%mutate(signal=replace_na(signal,0))%>%
    #Sizing
    mutate(
           size.c=1e5/N/close/fullpointvalue,
           size=case_when(
             signal & !lag(signal) ~ size.c,
             T ~ as.numeric(NA))
    )%>%fill(size)%>%mutate(size=replace_na(size,0))%>%
  ungroup()%>%
  mutate(
      strategy='Internal Bar Strength',
      allocation=1,
      ordertype='MKT'
  )
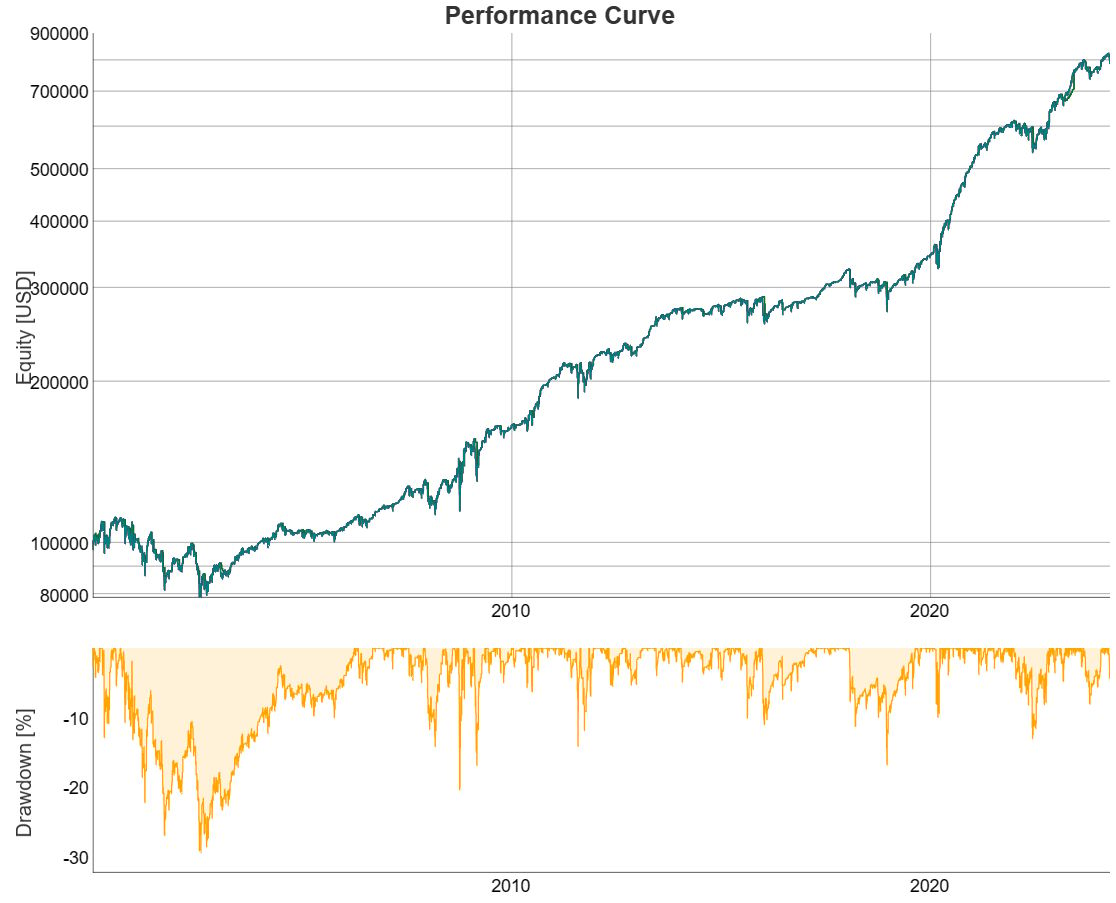
Here’s the performance with 1 tick slippage:
#Compute Backtest
BT%>%
  mutate(slippageTicks=1)%>%
  fComputePnL()%>%
  fCompoundPositions()%>%
  fComputePnL()%>%
  fPlotInteractivePerformanceChart()
And with 2 tick slippage, to check the magnitude of the edge:

Still positive.
Now let’s try a different IBD range, with 1 tick slippage. Enter Long when IBD<0.15 and Exit when IBD>0.85.

It holds up. Overall not bad performance for such a simple strategy.
Now let’s test a similar strategy in RealTest, which trades SPY, QQQ, IWM and DIA ETFs, also with 1/N sizing and IBD>0.2 entry, to double check:

Looks OK. Now…. note there is a relatively high correlation to S&P500

What’s next? To do similar analysis into different technical analysis indicators (RSI, etc..) and rules; and come up with a collection of technical analysis trading strategies.
These strategies which work in a few markets but fail in the rest, without a fundamental economic reason for doing so, are less robust and more prone to be random. The solution? To stack together a lot of these weak edges and watch closely over time. Trade with paper trading account for a few months before going live, to remove the crappy ones, then kill the ones that turn out to be random after a few months of live trading. And allocate less capital to these strategies than more robust strategies such as trend and carry.
This particular one goes to my strategy “incubator” in the paper trading account.
Lemme know what you think!


