Professional Bitcoin Mining Made Simple
With Bitcoin breaking through $120k recently, smart entrepreneurs aren't just buying at record highs - they're generating Bitcoin through professional mining operations at production cost.
Abundant Mines makes Bitcoin mining completely turnkey. You own the Bitcoin-generating equipment in our green energy facilities while our professionals handle everything else. No technical expertise required. No equipment management. No operational headaches.
Receive daily BTC payouts straight to your wallet, benefit from massive tax advantages through 100% bonus depreciation, and acquire Bitcoin significantly below market rates. It's like owning the money printer instead of buying the money.
Perfect for busy professionals who want serious Bitcoin exposure without complexity. Our clients include successful entrepreneurs who've scaled from test investments to multi-million dollar mining operations.
Claim your free month of professional Bitcoin hosting and see how the smart money generates Bitcoin.
🚀 Your Investing Journey Just Got Better: Premium Subscriptions Are Here! 🚀
It’s been 4 months since we launched our premium subscription plans at GuruFinance Insights, and the results have been phenomenal! Now, we’re making it even better for you to take your investing game to the next level. Whether you’re just starting out or you’re a seasoned trader, our updated plans are designed to give you the tools, insights, and support you need to succeed.
Here’s what you’ll get as a premium member:
Exclusive Trading Strategies: Unlock proven methods to maximize your returns.
In-Depth Research Analysis: Stay ahead with insights from the latest market trends.
Ad-Free Experience: Focus on what matters most—your investments.
Monthly AMA Sessions: Get your questions answered by top industry experts.
Coding Tutorials: Learn how to automate your trading strategies like a pro.
Masterclasses & One-on-One Consultations: Elevate your skills with personalized guidance.
Our three tailored plans—Starter Investor, Pro Trader, and Elite Investor—are designed to fit your unique needs and goals. Whether you’re looking for foundational tools or advanced strategies, we’ve got you covered.
Don’t wait any longer to transform your investment strategy. The last 4 months have shown just how powerful these tools can be—now it’s your turn to experience the difference.
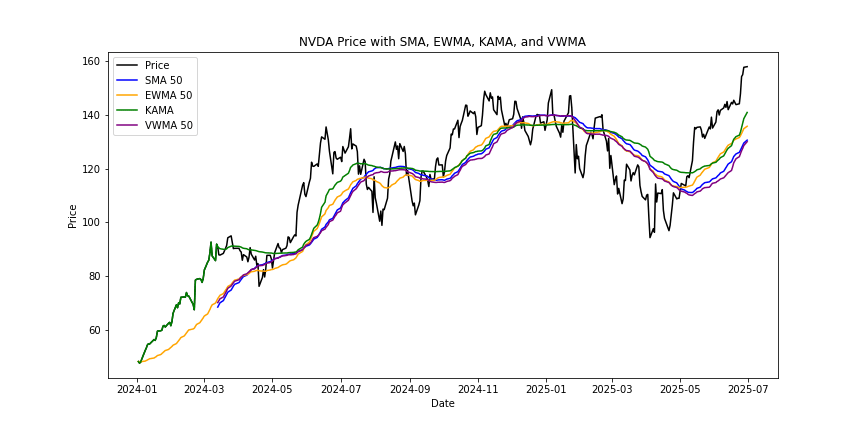
SMA, EWMA, KAMA and VWMA on NVIDIA’s Price Chart
When traders first encounter technical analysis, the chart can feel chaotic.
Candles rise and fall, trends form and vanish, and it’s easy to mistake randomness for opportunity. That’s where moving averages come in.
They help us see what the price has been doing over time, in a way that makes patterns visible without overcomplicating the picture.
This article walks through four essential moving averages used by traders and analysts alike, each with a distinct approach to interpreting price action:
Simple Moving Average (SMA)
Exponentially Weighted Moving Average (EWMA)
Kaufman Adaptive Moving Average (KAMA)
Volume Weighted Moving Averages (VWMA)
Each one has a distinct way of interpreting price action, and each reveals something different about the market’s rhythm.
Long Angle is a vetted community where entrepreneurs, executives, and investors exchange proven strategies – not sales pitches.
Members join to deepen financial mastery, access curated opportunities, and diversify beyond a single asset class.
Built on trust and candor, Long Angle fosters meaningful relationships in a no-fee, no-solicitation environment designed for genuine peer growth.
Simple Moving Average (SMA)
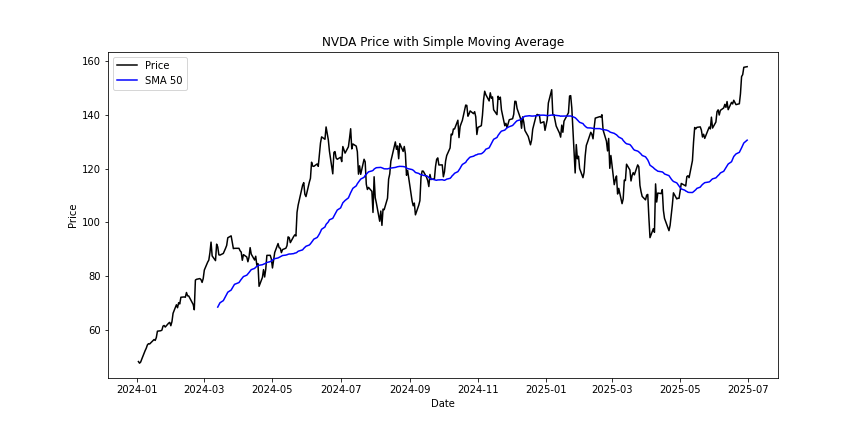
NVIDIA daily price with a 50-day Simple Moving Average.
The Simple Moving Average is the most straightforward way to smooth price data. It takes a set number of past prices, adds them up, and divides by that number. The result is a rolling line that moves gradually as new prices are added and old ones drop out.
Traders often use the SMA to identify trends. If the price is consistently above the SMA, it suggests upward momentum. When it’s below, it may indicate a downward trend. The longer the window you choose, for example, 50 or 200 days, the smoother the line becomes, and the slower it reacts to recent price changes.
The SMA doesn’t try to predict. It simply reflects what has already happened in a clear and stable way. That’s what makes it such a trusted foundation for many trading strategies.
Exponentially Weighted Moving Average (EWMA)
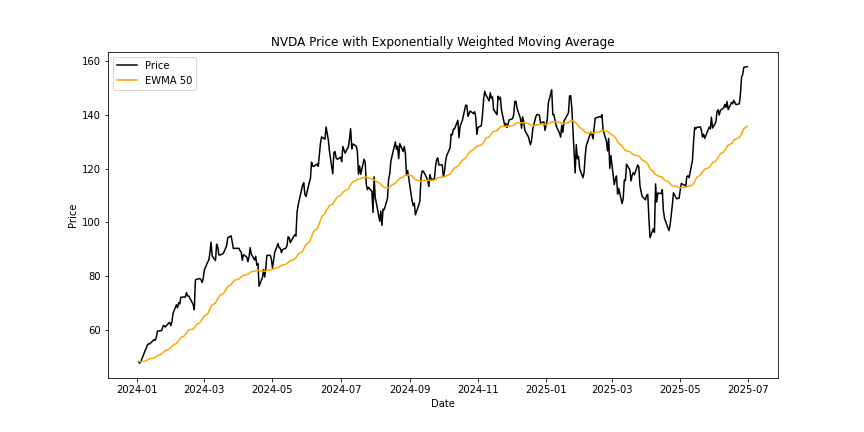
NVIDIA daily price with a 50-day Exponentially Weighted Moving Average.
The Exponentially Weighted Moving Average improves on the simplicity of the SMA by giving more importance to recent prices. Instead of treating all points equally, it applies exponential weighting so that yesterday’s data matters more than data from a month ago.
This makes the EWMA more responsive. When the market shifts direction, it adjusts faster, allowing traders to notice emerging trends earlier. However, that speed also makes it more sensitive to short-term volatility. In fast-moving markets, it can generate signals that appear early, sometimes too early.
Used thoughtfully, the EWMA is a great companion to the SMA. Together, they can help confirm whether a change in direction is gaining strength or just part of normal fluctuation.
Financial News Keeps You Poor. Here's Why.
The scandalous truth: Most market news is designed to inform you about what already happened, not help you profit from what's coming next.
When CNBC reports "Stock XYZ surges 287%"—you missed it.
What you actually need:
Tomorrow's IPO calendar (not yesterday's launches)
Crowdfunding deals opening this week (not closed rounds)
What real traders are positioning for (not TV talking heads)
Economic data that moves markets (before it's released)
The financial media industrial complex profits from keeping you one step behind.
Stocks & Income flips this backwards. We focus entirely on forward-looking intel that helps you get positioned before the crowd, not informed after the move.
Stop chasing trades that happened already.
Start prepping for the next one.
Stocks & Income is for informational purposes only and is not intended to be used as investment advice. Do your own research.
Kaufman Adaptive Moving Average (KAMA)
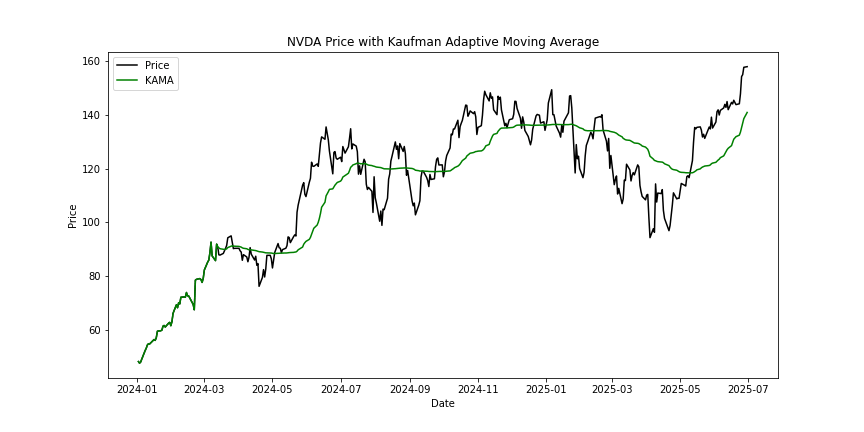
NVIDIA daily price with Kaufman Adaptive Moving Average.
The Kaufman Adaptive Moving Average takes adaptability to another level. Unlike the SMA or EWMA, which use fixed formulas, KAMA adjusts itself depending on how efficiently the market is moving.
When prices are trending smoothly, KAMA speeds up, staying close to the action. When the market becomes choppy and directionless, it slows down, filtering out unnecessary noise. The calculation involves an efficiency ratio that measures how directly price has moved compared to its volatility, in other words, how “purposeful” the market’s movement is.
The result is a line that breathes with the market’s pace. For traders who dislike constant false signals in sideways conditions, KAMA provides a more stable and realistic picture of underlying movement.
Volume Weighted Moving Average (VWMA)
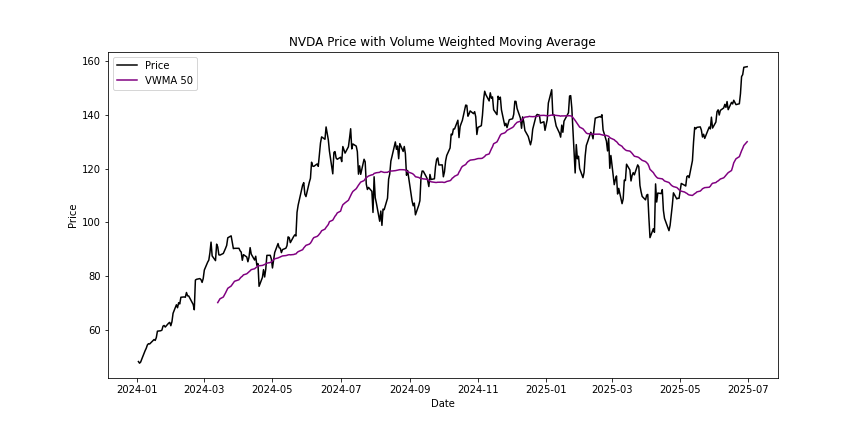
NVIDIA daily price with Volume Weighted Moving Average.
The Volume Weighted Moving Average adds another layer of meaning: it accounts for how much trading activity is happening. Instead of treating every price equally, VWMA gives more weight to prices that occur during high-volume periods.
This makes it especially insightful when analyzing market participation. A price move that happens on strong volume carries more significance than one that happens in quiet trading. By incorporating volume, the VWMA can confirm whether a trend is supported by real interest or just drifting on low liquidity.
It’s particularly useful in stocks or cryptocurrencies where volume spikes often precede strong price moves. Many traders use VWMA alongside other averages to check whether a breakout is backed by genuine momentum.
Seeing the Bigger Picture
Each moving average tells a slightly different story about the same price data. The SMA gives stability, the EWMA brings responsiveness, KAMA adapts intelligently, and VWMA introduces the reality of market activity.
When combined, they reveal layers of structure within what often appears to be chaos. Prices no longer move as random noise; they show phases, shifts, and slow transitions that the naked eye might miss.
For traders, understanding these differences is a way of learning to read markets more clearly. And once you can see those patterns, you can make decisions with a calmer mind, guided but by a more complete view of how prices evolve over time.
The code used to generate the diagrams in this article can be found in my GitHub Repository. Check it out to understand more about how these strategies work.


