
In partnership with

Apple's New Smart Display Confirms What This Startup Knew All Along

Apple has entered the smart home race with its new Smart Display, firing a $158B signal that connected homes are the future.
When Apple moves in, it doesn’t just join the market — it transforms it.
One company has been quietly preparing for this moment.
Their smart shade technology already works across every major platform, perfectly positioned to capture the wave of new consumers Apple will bring.
While others scramble to catch up, this startup is already shifting production from China to its new facility in the Philippines — built for speed and ready to meet surging demand as Apple’s marketing machine drives mass adoption.
With 200% year-over-year growth and distribution in over 120 Best Buy locations, this company isn’t just ready for Apple’s push — they’re set to thrive from it.
Shares in this tech company are open at just $1.90.
Apple’s move is accelerating the entire sector. Don’t miss this window.
Past performance is not indicative of future results. Email may contain forward-looking statements. See US Offering for details. Informational purposes only.
🚀 Your Investing Journey Just Got Better: Premium Subscriptions Are Here! 🚀
It’s been 4 months since we launched our premium subscription plans at GuruFinance Insights, and the results have been phenomenal! Now, we’re making it even better for you to take your investing game to the next level. Whether you’re just starting out or you’re a seasoned trader, our updated plans are designed to give you the tools, insights, and support you need to succeed.
Here’s what you’ll get as a premium member:
Exclusive Trading Strategies: Unlock proven methods to maximize your returns.
In-Depth Research Analysis: Stay ahead with insights from the latest market trends.
Ad-Free Experience: Focus on what matters most—your investments.
Monthly AMA Sessions: Get your questions answered by top industry experts.
Coding Tutorials: Learn how to automate your trading strategies like a pro.
Masterclasses & One-on-One Consultations: Elevate your skills with personalized guidance.
Our three tailored plans—Starter Investor, Pro Trader, and Elite Investor—are designed to fit your unique needs and goals. Whether you’re looking for foundational tools or advanced strategies, we’ve got you covered.
Don’t wait any longer to transform your investment strategy. The last 4 months have shown just how powerful these tools can be—now it’s your turn to experience the difference.
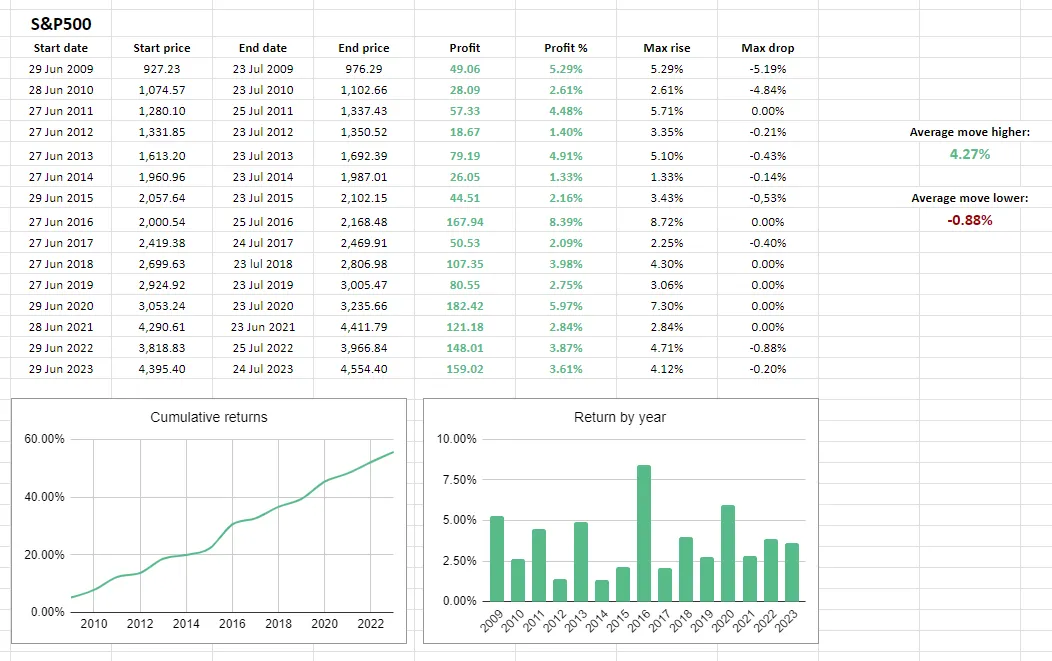
Did you know that over the past 15 years, the S&P500 has risen every single year between June 27 and July 24?
Not most years.
Not some years.
Every single year.
That’s the power of seasonality .
Predictable patterns woven into the fabric of the market.
Because these aren’t just interesting statistics.
No!
They’re actionable insights that can sharpen your trading strategies.
But hold on…
In this article we are going to highlight and explain the most consistent seasonal patterns in the S&P500 through the year.
The ones traders watch closely for good reason.
And so the ones that you can use to your advantage.
Alright!
What Top Execs Read Before the Market Opens
The Daily Upside was built by investment pros to give execs the intel they need—no fluff, just sharp insights on trends, deals, and strategy. Join 1M+ professionals and subscribe for free.
The S&P500’s most consistent seasonal flows:
First of all…
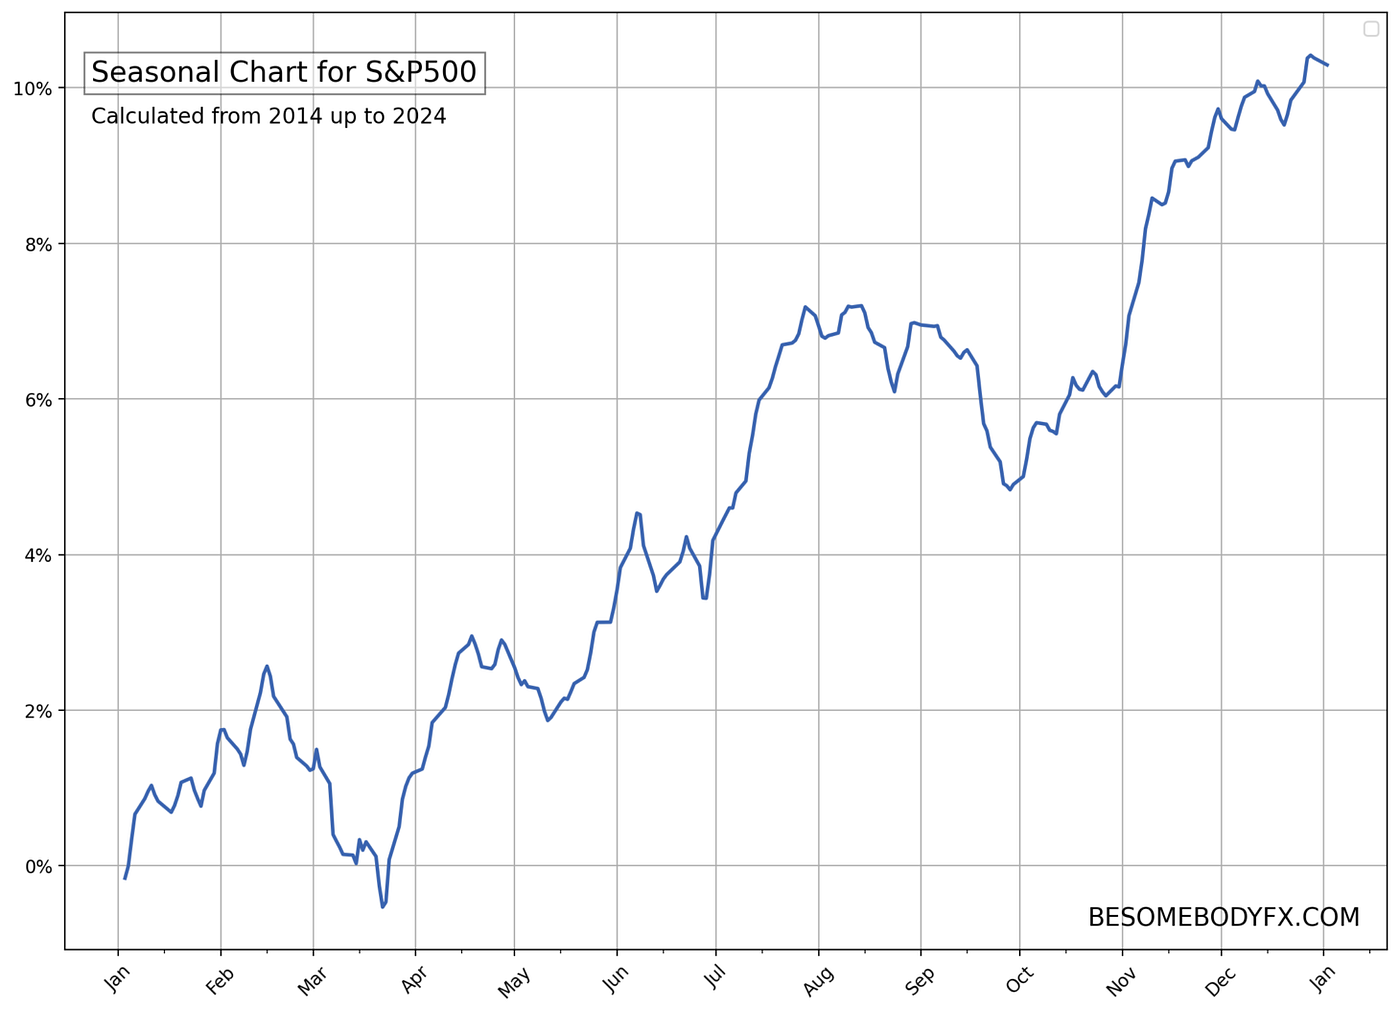
Let’s start with the overall S&P500 seasonal chart:
Ok.
With this we can quickly identify a few noticeable flows.
But let’s go with order.
And let’s start it with a BEARISH one.
Seasonal pattern number 1:
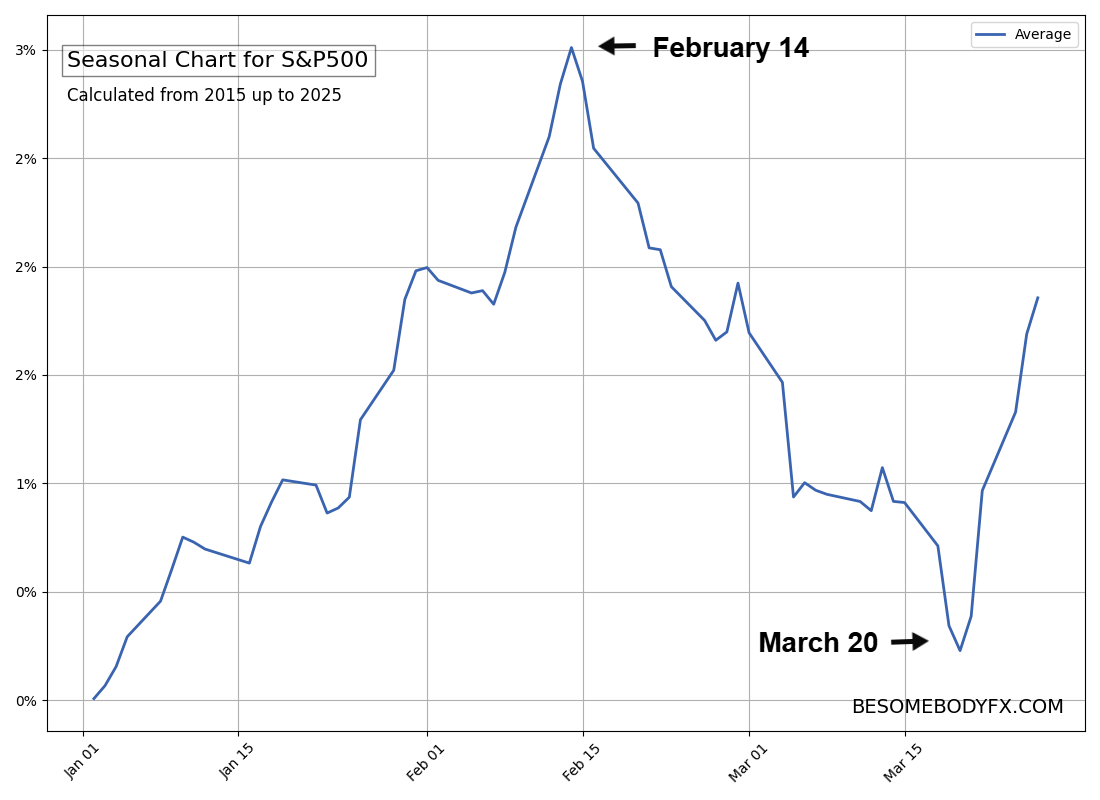
The mid February bearish flows.
Ok, first of all…
What are we looking at?
We are looking at a seasonal chart “zoomed in” on the S&P500 price action between January and March over the past 10 years.
In this we can see an interesting top that usually develops between February 14 and February 15.
From there there is a bearish flow that runs all the way into March.
Ok…
Great.
But is this all we need to know?
No!
This is where we dive deeper into the actual statistics to see over the past 10 years how the S&P500 has performed in this specific timerange.
And we do that year by year.
To pull all the information together.
So below you will find exactly year after year (since 2004) the S&P500 performance between February 15 and March 1.
Along other useful stats like the max rise and max drop within that period.
But ok!
Enough talking.
Here’s the data:

Hold on a second!
You might be thinking…
This does NOT look consistent at all.
And that’s true, because it’s a BEARISH pattern.
Keep in mind, the S&P500 is an asset that goes up like 70% of the time.
So you will NOT find any bearish flow that is as consistent as the bullish ones.
I mean…
Below (in the rest of the article) you will find bullish patterns that have like 90% or even 100% historical consistency.
But bearish ones?
It’s enough if we find something that has a 60% consistency.
Which is ok!
These are just guides to know when we need to be cautious about pullbacks and when instead we be VERY bullish instead.
Because remember…
Stocks only go up, right?!
IMAGE
With the bearish seasonal patterns personally I never look to short those (unless in a bear market) but rather I just use those as “caution time” to either take profit or be flat.
With that said…
Seasonal pattern number 2:
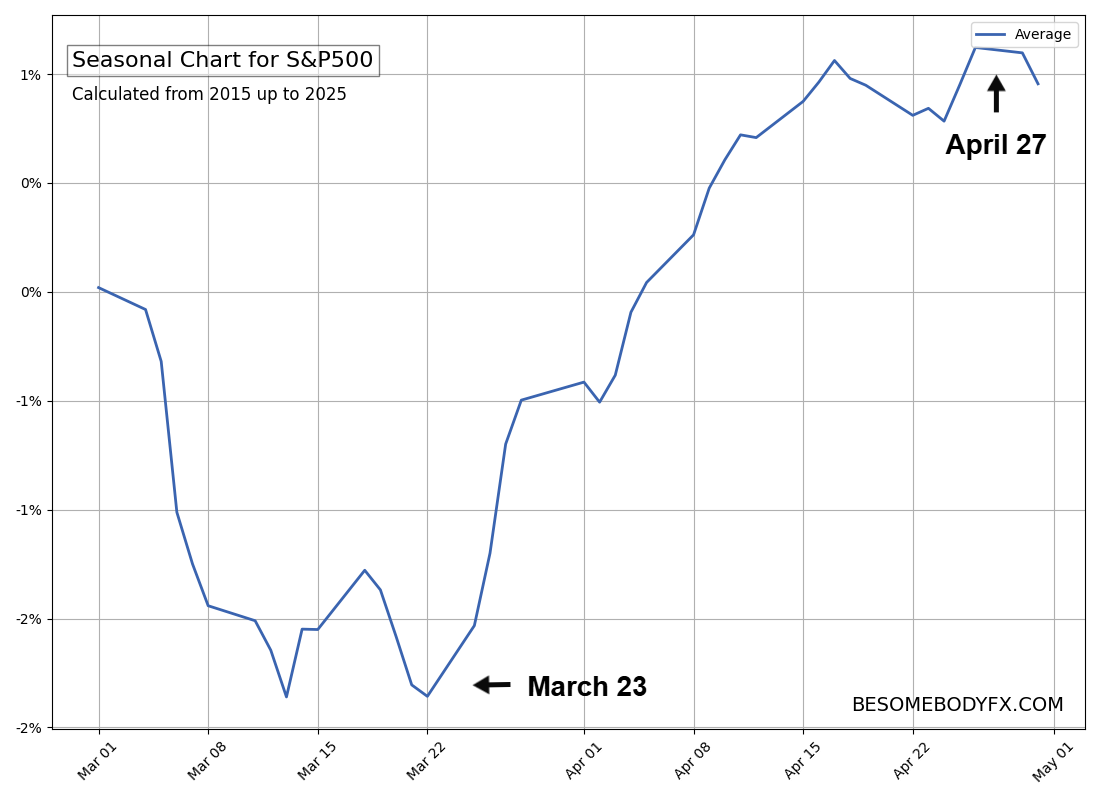
The late March rebound.
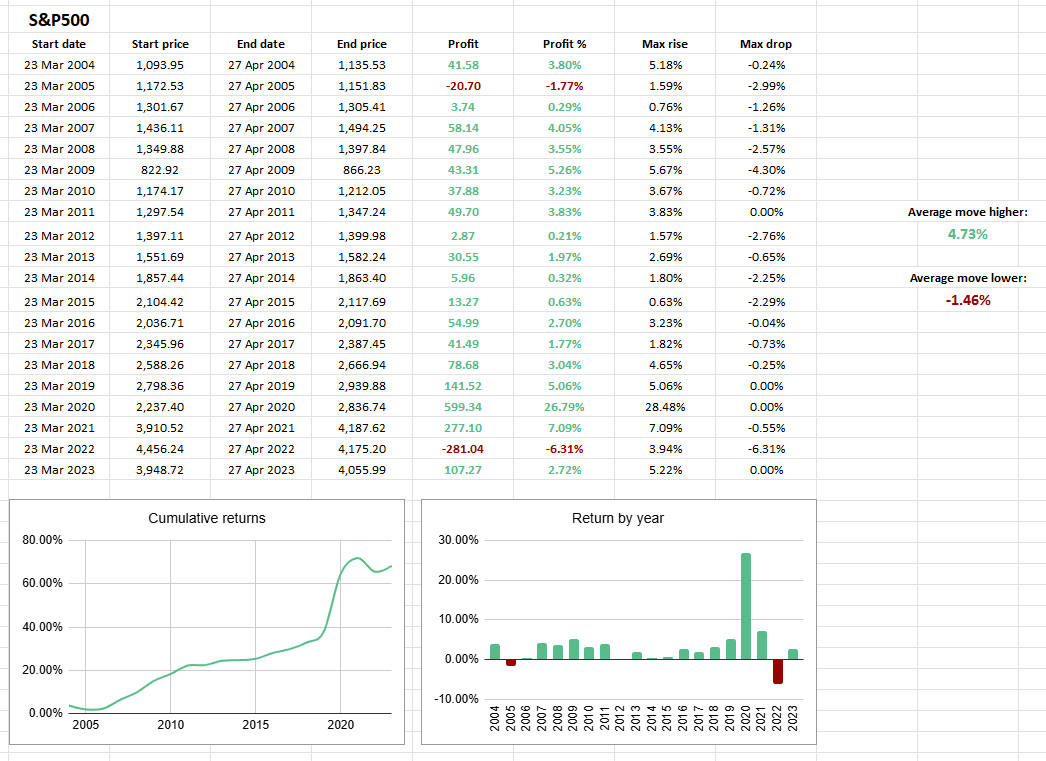
Now we are talking!
Over the past 20 years the S&P500 has been up 18 years out of 20 between March 23 and April 27.
Meaning…
If you bought on March 23, and took profit on March 27.
You would have netted a profit 18 times out of 20.
Cool, right?!
It sure is.
Seeking impartial news? Meet 1440.
Every day, 3.5 million readers turn to 1440 for their factual news. We sift through 100+ sources to bring you a complete summary of politics, global events, business, and culture, all in a brief 5-minute email. Enjoy an impartial news experience.
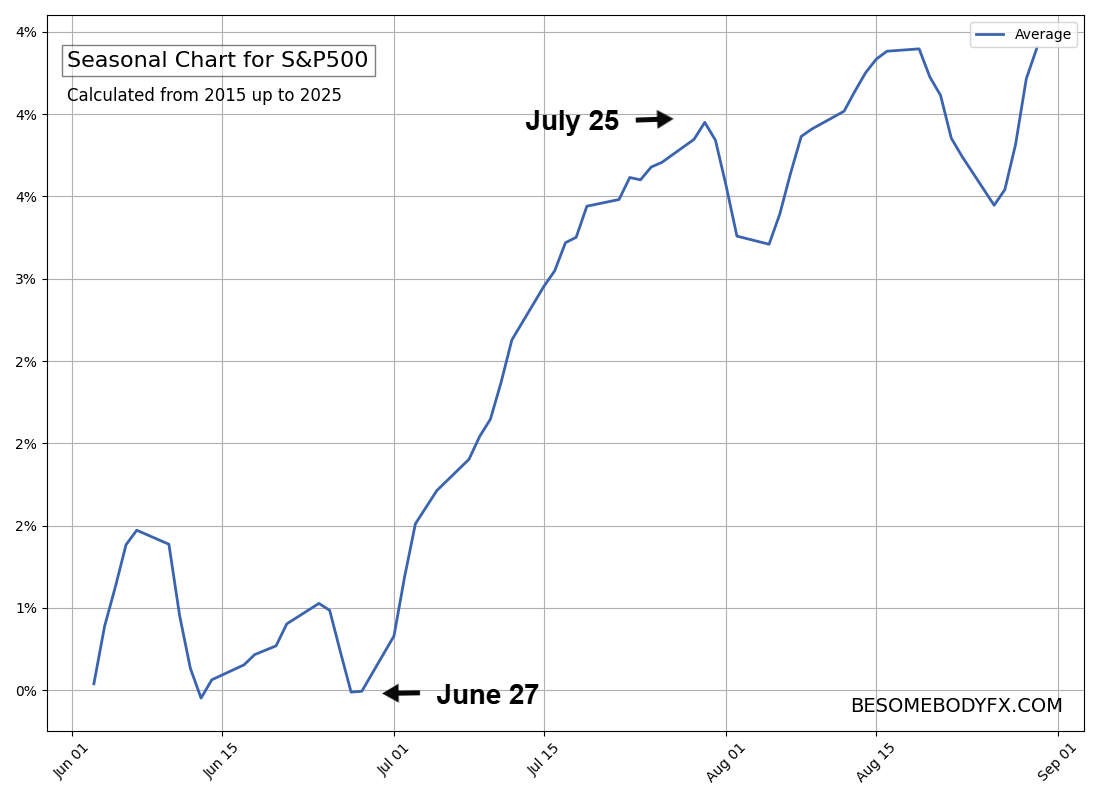
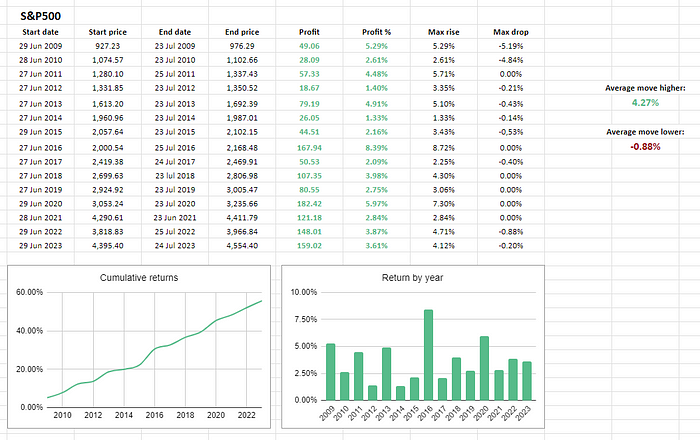
Seasonal pattern number 3:
The July rally.
Alright!
We are leveling up even further here.
Between June 29 and July 25 the S&P500 has been ALWAYS up since 2009.
Do I need to say that again?
Nah, you get the point!
Seasonality is powerful.
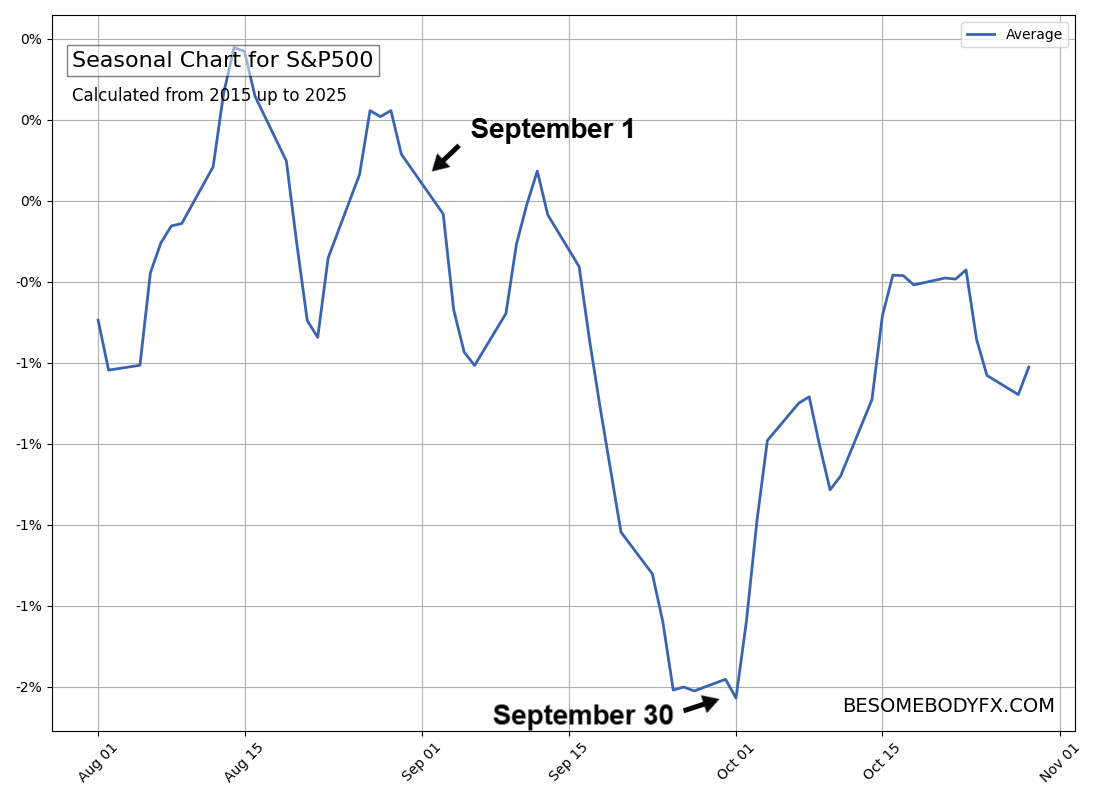
Seasonal pattern number 4:
The September chop.
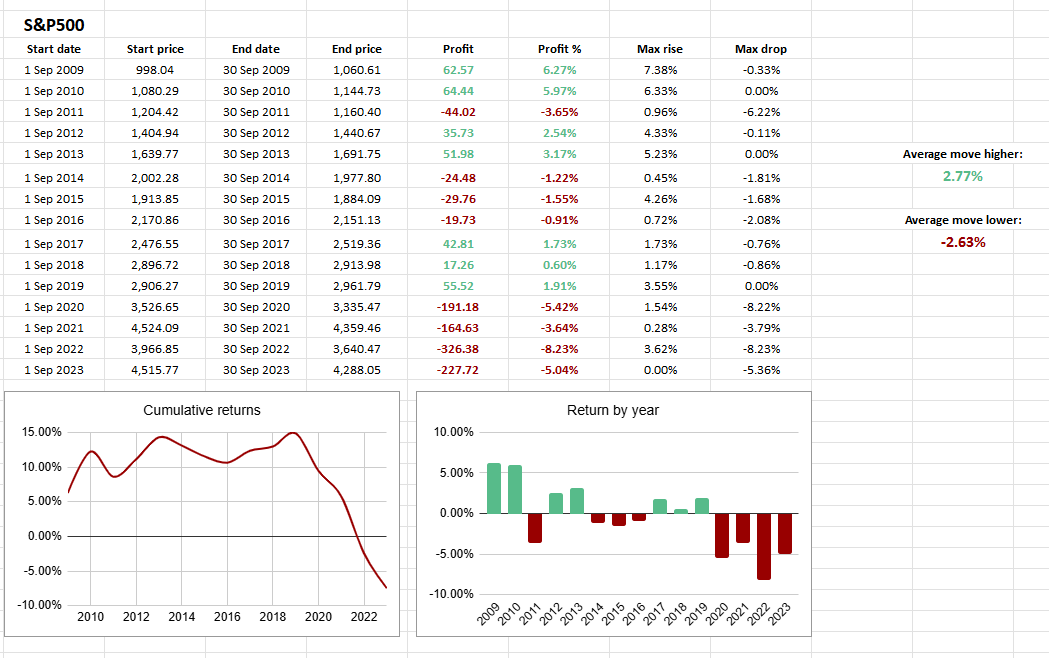
Ok.
Nothing too bullish here.
Nothing too bearish either.
Just acknowledging that September is usually a “choppy” month for the S&P500.
Sounds good!
Seasonal pattern number 6:
The November rally.

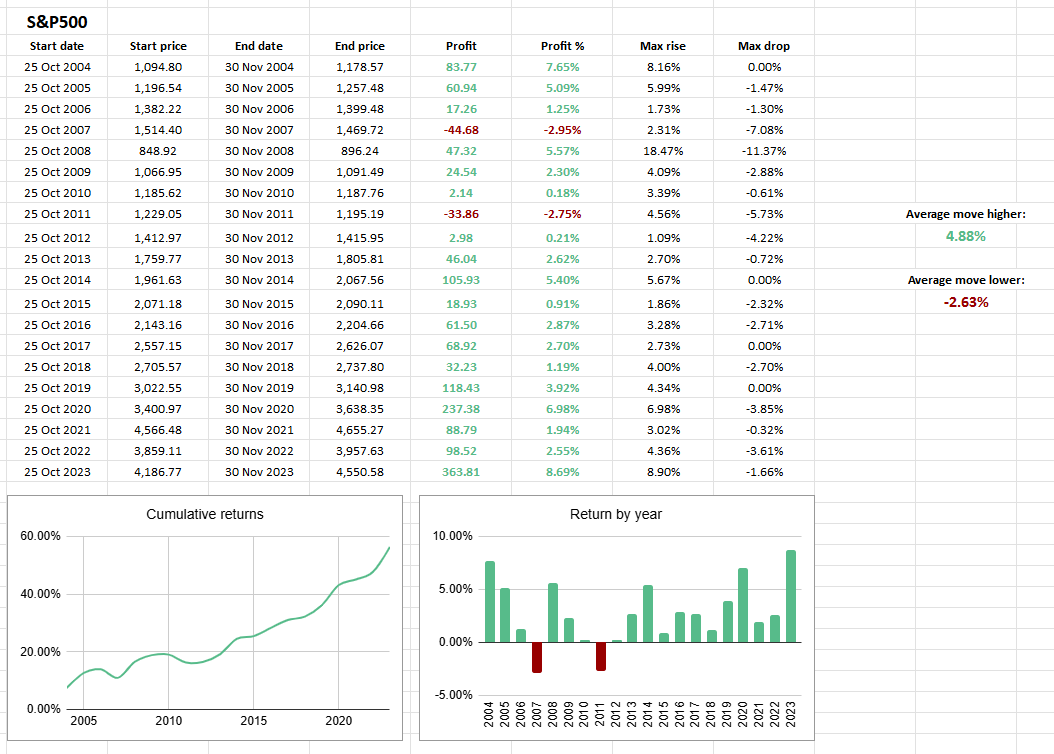
Once again, you can see how the bullish flows can be very consistent.
In this example since 2004 the S&P500 has been up almost all years.
With also an average move up of 4.8% which is quite a move higher!
And so there you go:
This is your guide to always know the best and most consistent seasonal patterns on the S&P500 in particular.
Like Gandalf guiding the Hobbits in their mission.

Use the guidance wisely.
Now there’s a couple of things you can do:
First is to bookmark this page to get back to it whenever you need to refresh these stats.
And second is to follow us to be alerted when we publish another article like this for other assets.
Maybe commodities?
Will see 😉