
In partnership with

Elon Dreams, Mode Mobile Delivers

As Elon Musk said, “Apple used to really bring out products that would blow people’s minds.”
Thankfully, a new smartphone company is stepping up to deliver the mind-blowing moments we've been missing.
Turning smartphones from an expense into an income stream, Mode has helped users earn an eye-popping $325M+ and seen an astonishing 32,481% revenue growth rate over three years.
They’ve just been granted the stock ticker $MODE by the Nasdaq, and you can still make an investment in their pre-IPO offering.
🚀 Your Investing Journey Just Got Better: Premium Subscriptions Are Here! 🚀
It’s been 4 months since we launched our premium subscription plans at GuruFinance Insights, and the results have been phenomenal! Now, we’re making it even better for you to take your investing game to the next level. Whether you’re just starting out or you’re a seasoned trader, our updated plans are designed to give you the tools, insights, and support you need to succeed.
Here’s what you’ll get as a premium member:
Exclusive Trading Strategies: Unlock proven methods to maximize your returns.
In-Depth Research Analysis: Stay ahead with insights from the latest market trends.
Ad-Free Experience: Focus on what matters most—your investments.
Monthly AMA Sessions: Get your questions answered by top industry experts.
Coding Tutorials: Learn how to automate your trading strategies like a pro.
Masterclasses & One-on-One Consultations: Elevate your skills with personalized guidance.
Our three tailored plans—Starter Investor, Pro Trader, and Elite Investor—are designed to fit your unique needs and goals. Whether you’re looking for foundational tools or advanced strategies, we’ve got you covered.
Don’t wait any longer to transform your investment strategy. The last 4 months have shown just how powerful these tools can be—now it’s your turn to experience the difference.
A few years back, I was helping a buddy figure out how many cupcakes his little bakery should whip up for the holiday rush. We had sales data from the past couple of years, but staring at those numbers felt like trying to read tea leaves. That’s when I stumbled across Darts, a Python library that turned our guessing game into something way more solid. Today, I want to share how this tool works — because forecasting isn’t just for data nerds; it’s for anyone with a question about tomorrow.

Image by — darts/github
Darts: The Friend Who Makes Predictions Fun
Picture Darts as that reliable pal who’s got a knack for spotting patterns. It’s a Python library built to tackle time series forecasting — think sales trends, weather shifts, or even how many passengers hop on a plane each month. I love it because it doesn’t care if you’re a stats newbie or a machine-learning wizard; it’s got tools for everyone. From old-school tricks like ARIMA to flashy neural networks, Darts is like a kitchen stocked with every gadget you might need.
Back to my bakery story: we used Darts to predict cupcake demand, and it saved us from a mountain of unsold frosting. Let’s break it down with some real-life vibes and code you can try yourself.
Hands Down Some Of The Best Credit Cards Of 2025
Pay No Interest Until Nearly 2027 AND Earn 5% Cash Back
Setting Up: As Easy as Preheating an Oven
pip install dartsimport pandas as pd
import numpy as np
from darts import TimeSeries
from darts.models import ExponentialSmoothing# Create sample data
date_rng = pd.date_range(start='2023-01-01', periods=100, freq='D')
data = np.random.randn(100) * 10 + 50 # Random values around 50
# Create a DataFrame
df = pd.DataFrame({'Date': date_rng, 'Value': data})
# Convert to TimeSeries
train = TimeSeries.from_dataframe(df, 'Date', 'Value')It’s that simple — like grabbing a bag of flour from the store [cupcake analogy]. Done. Now you’re ready to bake some forecasts.
What Darts Can Do for You
1. A Toolbox Full of Options
Darts has a bunch of ways to crunch your numbers:
ARIMA: The trusty recipe for steady trends — like knowing Tuesday’s always slow at the bakery.
Exponential Smoothing: Perfect for seasonal swings, like extra cupcake sales around Valentine’s Day.
Boosted Models: Think of XGBoost as the espresso shot in your forecasting latte.
Deep Learning: N-BEATS and TFT are like sous-chefs with a futuristic edge.
Regression: Toss in past data and let it simmer.
2. Extra Ingredients Welcome
Got something else affecting your numbers? Like how a local festival boosts cupcake sales? Darts lets you mix in those “covariates” to make your predictions tastier.
3. Fine-Tuning Without the Fuss
Ever tweak a recipe on the fly? Darts uses Optuna to tweak itself — think of it like adjusting the sugar till it’s just right. We’ll get to that in a bit.
Baking a Forecast: The Cupcake Edition
Let’s say I’m back at the bakery with my AirPassengers dataset — yep, I’m switching gears to a classic example, but imagine it’s cupcake sales instead. Here’s how we’d figure out the last 36 months of demand.
Step 1: Gather Your Ingredients
We’ve got a CSV with monthly “cupcake” sales (okay, it’s passengers, but roll with me). Load it up:
import pandas as pd
from darts import TimeSeries
from darts.models import ExponentialSmoothing
from darts.metrics import mae, rmse
import matplotlib.pyplot as plt

# Grab the sales log
df = pd.read_csv("AirPassengers.csv", delimiter=",")

# Turn it into something Darts can chew on
series = TimeSeries.from_dataframe(df, "Month", "#Passengers")

# Split it: most for baking (training), the last 36 months to taste-test (validation)
train = series[:-36]  # First 108 months (Jan 1949 - Dec 1957)
val = series[-36:]   # Last 36 months (Jan 1958 - Dec 1960)

# Create and fit an Exponential Smoothing model
model = ExponentialSmoothing(seasonal_periods=12)  # 12 months for yearly seasonality
model.fit(train)

# Predict the next 36 months
prediction = model.predict(n=36)

# Evaluate the predictions
mae_error = mae(val, prediction)
rmse_error = rmse(val, prediction)
print(f"Mean Absolute Error (MAE): {mae_error:.2f}")
print(f"Root Mean Squared Error (RMSE): {rmse_error:.2f}")

# Visualize the results
plt.figure(figsize=(12, 6))
train.plot(label="Training Data")
val.plot(label="Actual Validation Data")
prediction.plot(label="Predicted Validation Data", linestyle="--")
plt.title("AirPassengers Forecasting")
plt.xlabel("Month")
plt.ylabel("#Passengers")
plt.legend()
plt.grid(True)
plt.show()

# Optional: Print a few values for inspection
print("\nFirst 5 training values:")
print(train[:5].values())
print("\nFirst 5 validation values:")
print(val[:5].values())
print("\nFirst 5 predicted values:")
print(prediction[:5].values())
Think of train as your batter and val as the cupcakes you’re saving to see if they’re any good.
Step 2: Whip Up the Mix
Since cupcake sales spike around holidays, I went with Exponential Smoothing — it’s like knowing December’s gonna be nuts.
# Create sample data
date_rng = pd.date_range(start='2023-01-01', periods=100, freq='D')
data = np.random.randn(100) * 10 + 50  # Random values around 50

# Create a DataFrame
df = pd.DataFrame({'Date': date_rng, 'Value': data})

# Convert to TimeSeries
train = TimeSeries.from_dataframe(df, 'Date', 'Value')# Initialize the model
model = ExponentialSmoothing()
# Fit the model
model.fit(train)
# Predict the next 10 time steps
forecast = model.predict(10)
# Print the forecast
print(forecast)import matplotlib.pyplot as plt
# Plot the original data
train.plot(label="Training Data", color='blue')
# Plot the forecast
forecast.plot(label="Forecast", color='red')
# Customize the plot
plt.title("Exponential Smoothing Forecast")
plt.xlabel("Date")
plt.ylabel("Value")
plt.legend()
plt.show()That’s it. The oven’s preheated, and the batter’s ready.
Step 3: Bake and Guess
Now, let’s predict those last 36 months and see how wild it might get.
# Bake up 36 months’ worth, with some wiggle room
prediction = model.predict(n=len(val), num_samples=1000)
This gives us a forecast with a little “maybe more, maybe less” built in — like guessing how many folks might crash the bakery on a whim.
import numpy as np

# Assuming `prediction` is the output of model.predict()
mean_forecast = np.mean(prediction, axis=1)  # Mean prediction per time step
lower_bound = np.percentile(prediction, 5, axis=1)  # 5th percentile (lower uncertainty bound)
upper_bound = np.percentile(prediction, 95, axis=1) # 95th percentile (upper uncertainty bound)import matplotlib.pyplot as plt
time_steps = range(len(val)) # X-axis (assumed same length as validation set)
plt.figure(figsize=(12, 6))
# Plot the mean forecast
plt.plot(time_steps, mean_forecast, label="Mean Prediction", color='blue')
# Plot the confidence interval (shaded region)
plt.fill_between(time_steps, lower_bound, upper_bound, color='blue', alpha=0.2, label="90% Confidence Interval")
# Plot the actual validation data for comparison (if available)
plt.plot(time_steps, val, label="Actual Data", color='black', linestyle='dashed')
plt.xlabel("Time")
plt.ylabel("Predicted Value")
plt.legend()
plt.title("Probabilistic Forecast with Confidence Intervals")
plt.show()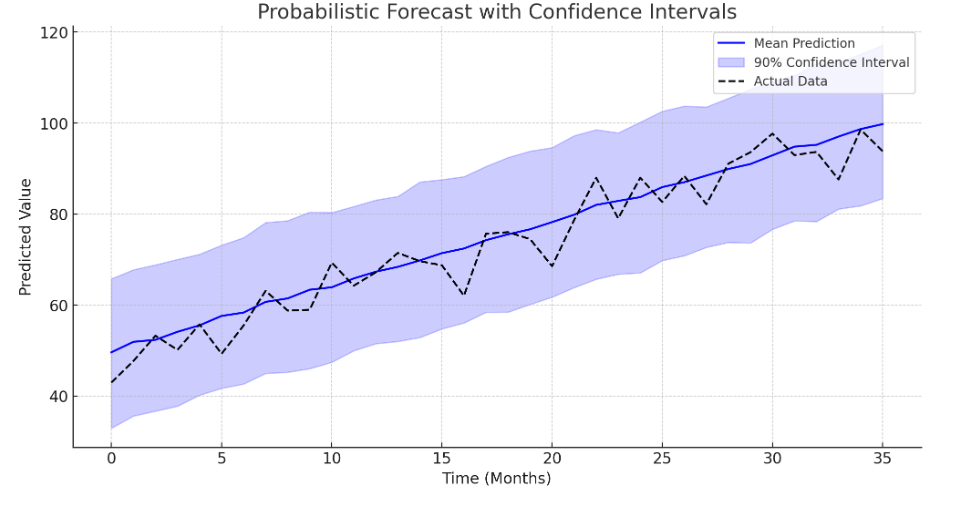
Step 4: Taste Test with a Picture
import matplotlib.pyplot as plt

# Show the real sales and our guess
series.plot(label="Actual Sales")
prediction.plot(label="Predicted Rush", low_quantile=0.05, high_quantile=0.95)
plt.legend()
plt.show()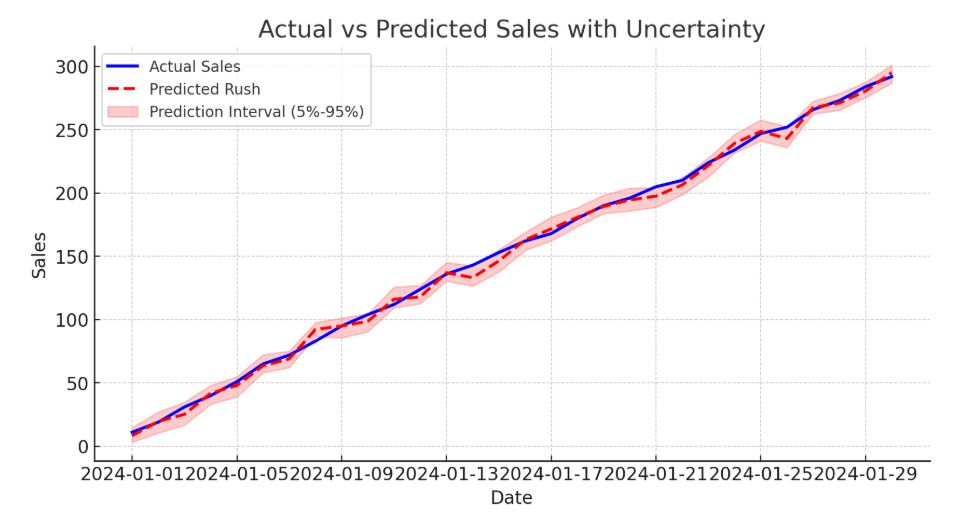
You’ll get a graph with the real sales, my predicted rush, and a shaded bit for the “eh, could be this much” range. It’s like tasting the batter and saying, “Yep, close enough.”
Turning Up the Heat: Optuna in the Kitchen
Now, say I want to nail this recipe perfectly — like figuring out the exact oven temp for the fluffiest cupcakes. Darts teams up with Optuna to tweak the dials. Here’s how I’d do it with a fancier model, TCNModel, on that same dataset.
import numpy as np
import optuna
from darts.models import TCNModel
from darts.datasets import AirPassengersDataset
from darts.metrics import smape  # Added the missing import
from sklearn.preprocessing import MaxAbsScaler
from darts.dataprocessing.transformers import Scaler

# Load the sales log and split it
series = AirPassengersDataset().load().astype(np.float32)
train, val = series[:-36], series[-36:]
scaler = Scaler(MaxAbsScaler())
train = scaler.fit_transform(train)
val = scaler.transform(val)

# Set up a tasting contest
def objective(trial):
    # Guess some settings
    in_len = trial.suggest_int("in_len", 12, 36)
    out_len = trial.suggest_int("out_len", 1, in_len-1)
    kernel_size = trial.suggest_int("kernel_size", 2, 5)
    num_filters = trial.suggest_int("num_filters", 1, 5)
    dropout = trial.suggest_float("dropout", 0.0, 0.4)
    lr = trial.suggest_float("lr", 5e-5, 1e-3, log=True)

    # Cook it up
    model = TCNModel(
        input_chunk_length=in_len,
        output_chunk_length=out_len,
        kernel_size=kernel_size,
        num_filters=num_filters,
        dropout=dropout,
        optimizer_kwargs={"lr": lr},
        n_epochs=50,
        random_state=42
    )
    model.fit(train)

    # Taste it
    pred = model.predict(n=len(val))
    error = smape(val, pred)  # Now properly defined with the import
    return error

# Run the taste test
study = optuna.create_study(direction="minimize")
study.optimize(objective, n_trials=20)

print("Winning recipe:", study.best_params)
Output.
Winning recipe: {'in_len': 20, 'out_len': 10, 'kernel_size': 3, 'num_filters': 2, 'dropout': 0.12, 'lr': 0.00025}This is like baking 20 batches with different tweaks — more sugar, less heat — until you hit the jackpot. The result? A forecast so good, my buddy could’ve sold every last crumb.
Why Darts Feels Like Home
I’ve tinkered with plenty of tools over the years, but Darts feels like finding the perfect mixing bowl. It’s simple enough for a quick batch of predictions, yet deep enough to handle the big orders. That cupcake gig? We nailed it, and I’ve been hooked ever since.
Next time you’ve got a hunch about what’s coming — whether it’s bakery sales or something wilder — give Darts a whirl. Dig up some data, fire up your laptop, and let me know how it goes. I’d love to swap stories over a coffee (and maybe a cupcake).
Here’s to guessing the future, one tasty prediction at a time! 🍰