
In partnership with

Don’t snooze on student loans

June is the sweet spot to start planning how you’ll cover what FAFSA doesn’t.
You’ve got time to compare options, talk it over with a co-signer, and find a private loan that actually fits your life.
Think beyond tuition—the right student loan can cover housing, meal plans, and even your laptop.
View Money’s best student loans list to find a lender, apply in as little as 3 minutes, and start the semester on the right foot.
🚀 Your Investing Journey Just Got Better: Premium Subscriptions Are Here! 🚀
It’s been 4 months since we launched our premium subscription plans at GuruFinance Insights, and the results have been phenomenal! Now, we’re making it even better for you to take your investing game to the next level. Whether you’re just starting out or you’re a seasoned trader, our updated plans are designed to give you the tools, insights, and support you need to succeed.
Here’s what you’ll get as a premium member:
Exclusive Trading Strategies: Unlock proven methods to maximize your returns.
In-Depth Research Analysis: Stay ahead with insights from the latest market trends.
Ad-Free Experience: Focus on what matters most—your investments.
Monthly AMA Sessions: Get your questions answered by top industry experts.
Coding Tutorials: Learn how to automate your trading strategies like a pro.
Masterclasses & One-on-One Consultations: Elevate your skills with personalized guidance.
Our three tailored plans—Starter Investor, Pro Trader, and Elite Investor—are designed to fit your unique needs and goals. Whether you’re looking for foundational tools or advanced strategies, we’ve got you covered.
Don’t wait any longer to transform your investment strategy. The last 4 months have shown just how powerful these tools can be—now it’s your turn to experience the difference.

Most financial machine learning is supervised: models trained to predict returns or classify regimes. I took a different approach, using K-Means — an unsupervised clustering method — to uncover structure in fundamentals and trade on it.
Here is the key insight: a P/E ratio of 25 means something completely different for a tech stock versus a utility stock. Clustering solves this issue by automatically grouping stocks with similar characteristics, so that we can assess a stock’s current financial positioning without the structural bias associated with the stock.
Used by Execs at Google and OpenAI

Join 400,000+ professionals who rely on The AI Report to work smarter with AI.
Delivered daily, it breaks down tools, prompts, and real use cases—so you can implement AI without wasting time.
If they’re reading it, why aren’t you?
Traditional models treat all P/E ratios the same way, but context is everything. Consider NVIDIA at a P/E of 45 versus 25:
P/E 45: High for the S&P 500, but normal for growth tech
P/E 25: Still high for the S&P 500, but alarming for a growth stock
A naïve feature engineering model would treat both P/E ratios the same way: high. But they are missing the dramatic shift in NVIDIA’s growth story.
Now, you might just think to calculate P/E changes over time, constructing a lagged feature vector or engineering delta-P/E features. But this misses sector-wide shifts. Imagine new utility rate caps crush the entire sector’s growth expectations. A utility stock’s P/E rising from 12 to 18 looks terrible in isolation — higher P/E typically suggests the stock is getting expensive. But if its peers’ P/E ratios soar to 25, that stock is actually relatively cheap and outperforming. A basic algorithmic trading strategy based on P/E ratios would likely give the outperforming utility stock a sell signal, seeing the P/E increase as a negative. However, the sector context shows this should actually be a strong buy signal — the stock is trading at a discount relative to its peers. The Solution: Cluster-Relative Features.
Algorithmic Trading Pipeline
The strategy follows a modular framework of preprocessing, unsupervised clustering, feature engineering, supervised learning, and portfolio construction.

Feature Engineering
Each quarter, a K-Means model is trained to group stocks into clusters based on their fundamental features. 11 clusters consistently yielded the best silhouette scores, though the strategy remains robust across a range of cluster counts. Before clustering and modeling, all fundamental features are log-transformed and scaled using a robust scaler to mitigate the effects of heavy tails and outliers commonly found in financial data.
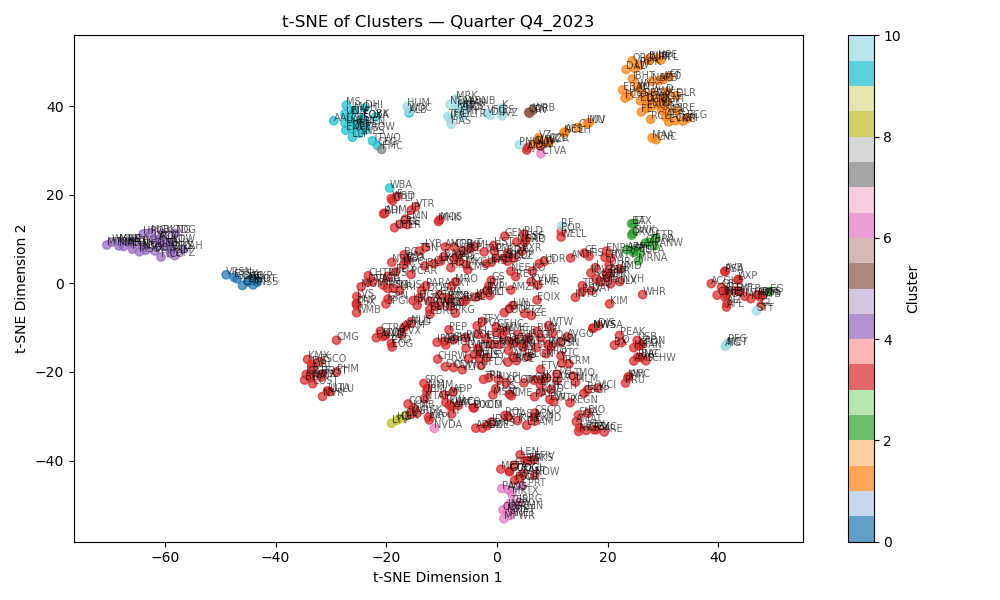
t-SNE plot of Cluster Assignments for Q4 2023
For each stock within the cluster, we compute several engineered features:
Relative Cluster Position: The difference between a stock’s fundamental vector and the cluster’s mean vector.
Temporal Divergence of Relative Cluster Position: The change in a stock’s position relative to its cluster peers between two consecutive quarters, highlighting momentum or deterioration in fundamentals.
Cluster-Relative Return: The stock’s return from quarter t to t + 1, normalized by the average return of its cluster over the same period.
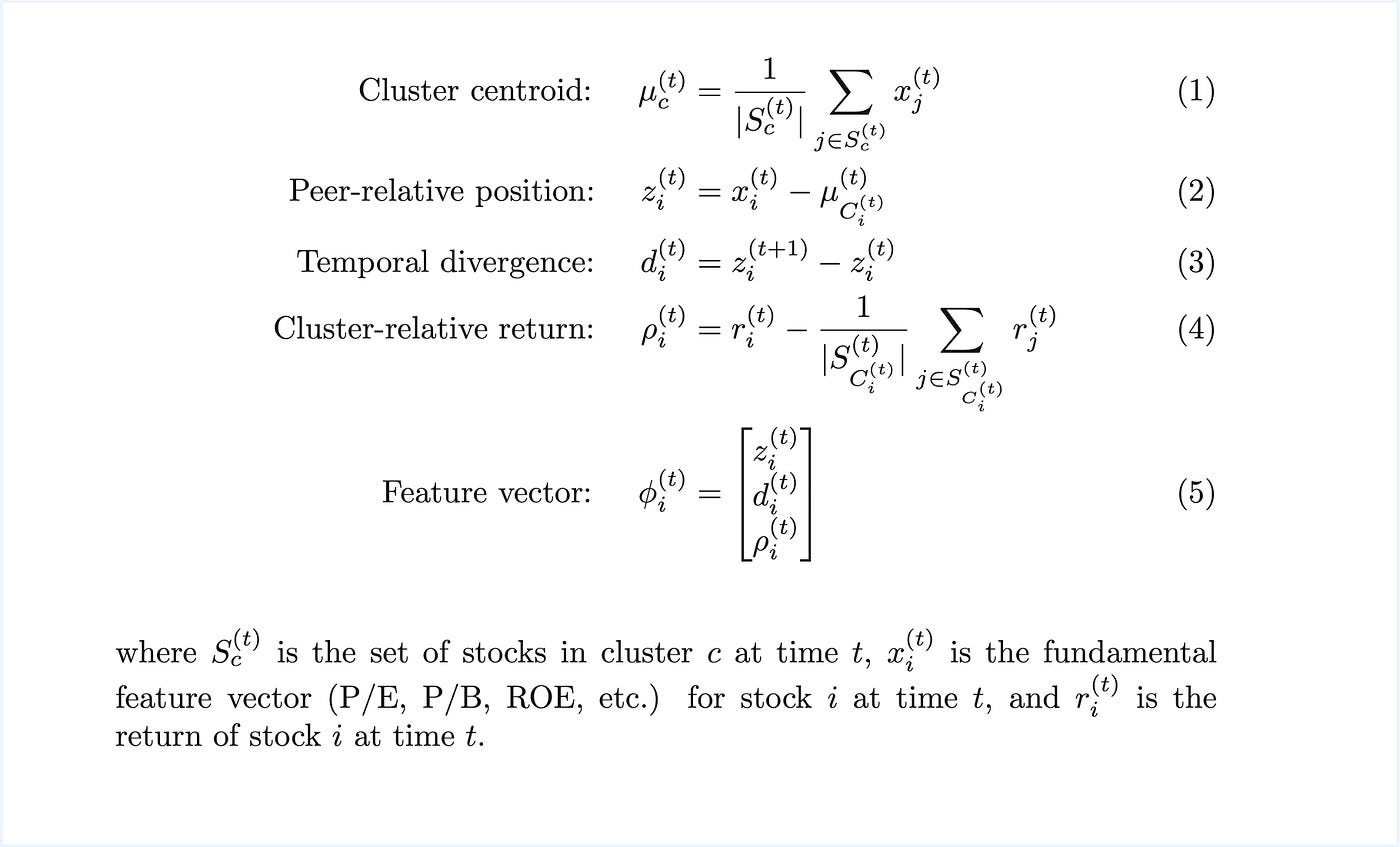
Mathematical Formulation of Engineered Features
Finally, a target value is calculated to train the machine learning models. Specifically, we assign each stock a label based on its cluster-relative return over the next quarter. Stocks in the top quartile of cluster-relative returns are labeled as positive examples, while those in the bottom third are labeled as negative. The middle 50% are treated as neutral.
We hypothesize that it is “too difficult” to predict how a stock will perform relative to the rest of the market based on fundamental indicators. However, predicting how a stock will perform relative to its peer group is much more straightforward and still correlates to positive performance. This formulation emphasizes relative outperformance rather than absolute return, making the model more resilient to shifting market regimes. By anchoring the target to intra-cluster rankings, we encourage the model to focus on peer-based alpha signals rather than broad market trends.
Dynamic Cluster Prediction
Each quarter, a classifier is trained based on the data generated by the feature engineering process outlined above. The model learns to identify patterns in fundamental and temporal divergence features that precede cluster-relative outperformance.
We use a Random Forest classifier due to its robustness to noise, ability to capture non-linear relationships, and interpretability. Model hyperparameters are not tuned to avoid overfitting to the market data.
Importantly, because clusters are redefined each quarter, the model is not learning absolute rules about specific stocks, but rather relational rules — how certain traits signal outperformance within a peer group. This dynamic learning process enables the strategy to adapt to structural changes in market composition, sector rotations, and evolving valuation regimes.
The output is a probability score for each stock, indicating the likelihood of future outperformance relative to its cluster. At each quarter, the stocks are ranked based on future outperformance, and the top-10 stocks are purchased. For existing positions, any stock that falls into the bottom third of predicted scores is removed from the portfolio, ensuring capital is consistently allocated toward the most promising opportunities.
Backtesting
Backtests were run on a quarterly step-forward basis using fundamental data from the S&P 500 universe. We implemented a conservative lag between quarter end and presumed earnings dates, ensuring no data leakage. Universe selection used point-in-time S&P 500 membership to avoid survivorship bias, with stocks entering/exiting the backtest based on their actual inclusion dates. The strategy was tested across multiple market regimes (2008–2024) including the financial crisis, COVID crash, and various rate environments to assess regime stability.
Results
The strategy achieved a Sharpe ratio of 1.33 and a compound annual growth rate (CAGR) of 32% over the evaluation period.
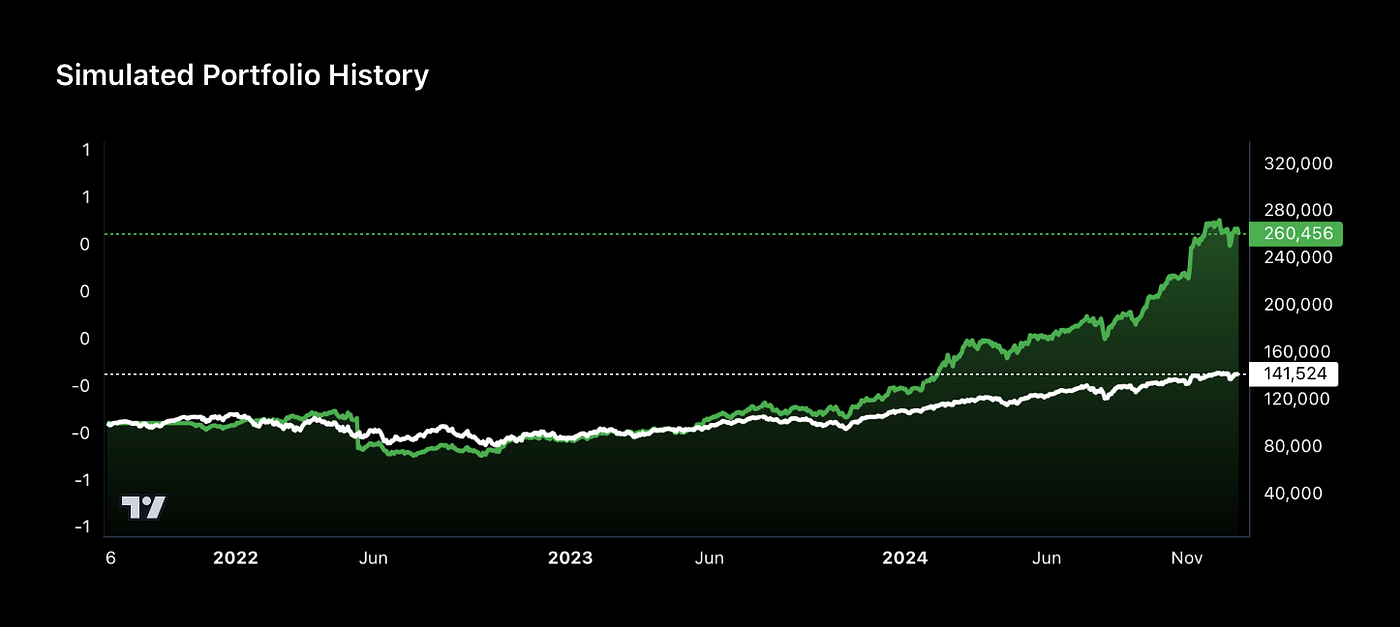
Strategy Earnings (green) vs. SPY (white) from 2021–2025
Further testing confirmed the importance of:
Temporal divergence features, which capture evolving stock roles within clusters
Cluster-relative returns, as a more stable target than raw returns
Robust scaling and log transformation, which improved model stability and generalization
Implications and Next Steps
This strategy shows that unsupervised learning can meaningfully enhance financial prediction pipelines, especially in the context of peer-relative valuation. Rather than predicting global alpha directly, unsupervised methods allowed us to isolate intra-cluster dynamics. This is ultimately simpler and more robust under market shifts.
Further work will include the following:
Development of a long-short model to allow a dollar-neutral strategy to minimize market correlation and potentially decrease max-drawdown.
Experiment with alternative clustering algorithms (DBSCAN, hierarchical, Gaussian Mixture Models)
Experiment with alternative classification algorithms (MLP, Gradient Boosting)
These improvements may push performance further while ensuring robustness across market regimes.