
In partnership with

Expert investment picks that have returned 200%+

AIR Insiders get picks from expert investors and industry leaders sent straight to their inbox every week. Picks like:
Jason Calacanis recommending Uber at $25/share (200%+ return)
Anthony Scaramucci recommending Bitcoin at $29,863 (200%+ return)
Sim Desai recommending OpenAI at an $86 billion market cap (200%+ return)
Looking to invest in real estate, private credit, pre-IPO ventures or crypto? Just sign up for our 2-week free trial so you can experience all the benefits of being an AIR Insider.
🚀 Your Investing Journey Just Got Better: Premium Subscriptions Are Here! 🚀
It’s been 4 months since we launched our premium subscription plans at GuruFinance Insights, and the results have been phenomenal! Now, we’re making it even better for you to take your investing game to the next level. Whether you’re just starting out or you’re a seasoned trader, our updated plans are designed to give you the tools, insights, and support you need to succeed.
Here’s what you’ll get as a premium member:
Exclusive Trading Strategies: Unlock proven methods to maximize your returns.
In-Depth Research Analysis: Stay ahead with insights from the latest market trends.
Ad-Free Experience: Focus on what matters most—your investments.
Monthly AMA Sessions: Get your questions answered by top industry experts.
Coding Tutorials: Learn how to automate your trading strategies like a pro.
Masterclasses & One-on-One Consultations: Elevate your skills with personalized guidance.
Our three tailored plans—Starter Investor, Pro Trader, and Elite Investor—are designed to fit your unique needs and goals. Whether you’re looking for foundational tools or advanced strategies, we’ve got you covered.
Don’t wait any longer to transform your investment strategy. The last 4 months have shown just how powerful these tools can be—now it’s your turn to experience the difference.

This article introduces a backtrader strategy, VSAStrategy, designed to identify trading opportunities based on Volume Spread Analysis (VSA) principles. VSA interprets the interaction between price, volume, and spread (range of the bar) to infer the actions of "smart money" (institutional traders). This strategy quantifies several key VSA patterns and integrates a dynamic trailing stop for robust risk management. It is then rigorously evaluated using a rolling backtesting methodology.
Smarter Investing Starts with Smarter News
The Daily Upside helps 1M+ investors cut through the noise with expert insights. Get clear, concise, actually useful financial news. Smarter investing starts in your inbox—subscribe free.
1. The VSA Strategy Concept
The VSAStrategy attempts to codify classic VSA patterns, which are typically visual and interpretive, into concrete trading rules. The core idea is that unusual combinations of volume, price spread, and closing position within a bar can reveal underlying supply and demand dynamics, indicating market strength or weakness.
Key Concepts and Components:
Volume Classification: Categorizes current volume as
climax,high,normal, orlowrelative to its moving average.Spread Classification: Categorizes the bar’s range (
high - low) aswide,normal, ornarrowrelative to its moving average.Close Position: Determines where the closing price falls within the bar’s range (e.g.,
high,middle,low), indicating the strength of buying or selling pressure within that bar.Trend Determination: Uses a simple Moving Average of the close price to identify the prevailing trend (
up,down, orsideways).VSA Pattern Detection: Combines the above classifications to identify various VSA patterns, each assigned a “strength” score. Examples include:
No Demand / No Supply: Signals of weakness/strength, often seen after significant moves, where price attempts to move but on low volume.
Stopping Volume / Climax Volume: Signs of potential trend exhaustion, where very high volume accompanies a significant price move, but the close suggests a struggle.
Effort vs. Result: High volume with little price progress (narrow spread) can indicate absorption of supply/demand.
Tests: Low volume retests of prior support/resistance levels, confirming their strength.
Background Context: Analyzes recent historical bars to add a “context score,” recognizing that VSA signals are more reliable when confirmed by the surrounding market action.
Trading Logic:
The strategy enters a position (long or short) based on identified VSA patterns that meet a minimum combined strength threshold (pattern strength + context strength).
It also uses bullish VSA patterns to exit existing short positions, and bearish patterns to exit existing long positions, indicating a potential reversal.
Dynamic Trailing Stop: A crucial risk management tool that moves the stop loss as the trade becomes profitable, locking in gains.
For long positions, the stop trails the highest price reached by a fixed percentage.
For short positions, the stop trails the lowest price reached by a fixed percentage.
2. The VSAStrategy Implementation
class VSAStrategy(bt.Strategy):
    params = (
        ('volume_period', 7),       # Period for volume averages
        ('volume_threshold', 1.2),  # High volume threshold (e.g., 1.2x average)
        ('spread_period', 7),       # Period for spread averages
        ('spread_threshold', 1.2),  # Wide spread threshold (e.g., 1.2x average)
        ('trend_period', 30),       # Trend determination period for SMA
        ('climax_volume_mult', 2.0),# Climax volume multiplier (e.g., 2.0x average)
        ('test_volume_mult', 0.5),  # Test volume multiplier (e.g., 0.5x average for low volume)
        ('trail_stop_pct', 0.05),   # 5% trailing stop loss
    )

    def __init__(self):
        # Price data feeds
        self.high = self.data.high
        self.low = self.data.low
        self.close = self.data.close
        self.open = self.data.open
        self.volume = self.data.volume

        # VSA raw components: spread and close position within range
        self.spread = self.high - self.low  # True range of the bar
        # Calculate where the close is within the bar's range (0 = low, 1 = high)
        self.close_position = bt.If(self.spread != 0, (self.close - self.low) / self.spread, 0.5)

        # Moving averages for comparison
        self.volume_ma = bt.indicators.SMA(self.volume, period=self.params.volume_period)
        self.spread_ma = bt.indicators.SMA(self.spread, period=self.params.spread_period)

        # Trend determination using a simple moving average
        self.trend_ma = bt.indicators.SMA(self.close, period=self.params.trend_period)

        # VSA signal tracking (for internal use)
        self.vsa_signal = 0        # Placeholder for detected signal type (e.g., bullish/bearish)
        self.signal_strength = 0   # Strength of the detected signal
        self.last_signal_bar = 0   # Bar index of the last signal, to prevent too frequent trades

        # Trailing stop tracking variables
        self.trail_stop_price = 0  # Current price level of the trailing stop
        self.entry_price = 0       # Price at which the current position was entered

        # Backtrader order tracking
        self.order = None          # Stores reference to the current entry/exit order
        self.stop_order = None     # Stores reference to the current trailing stop order

    def log(self, txt, dt=None):
        ''' Logging function for strategy actions '''
        dt = dt or self.datas[0].datetime.date(0)
        print(f'{dt.isoformat()} - {txt}')

    def classify_volume(self):
        """Classify current bar's volume relative to its moving average"""
        # Ensure indicator has enough data and MA is not zero to prevent errors
        if np.isnan(self.volume_ma[0]) or self.volume_ma[0] == 0 or self.volume[0] == 0:
            return 'normal'

        volume_ratio = self.volume[0] / self.volume_ma[0]

        if volume_ratio >= self.params.climax_volume_mult:
            return 'climax' # Extremely high volume, potential exhaustion
        elif volume_ratio >= self.params.volume_threshold:
            return 'high'   # Higher than average volume
        elif volume_ratio <= self.params.test_volume_mult:
            return 'low'    # Very low volume, often indicates a test of supply/demand
        else:
            return 'normal' # Average volume

    def classify_spread(self):
        """Classify current bar's spread (range) relative to its moving average"""
        # Ensure indicator has enough data and MA is not zero
        if np.isnan(self.spread_ma[0]) or self.spread_ma[0] == 0 or self.spread[0] == 0:
            return 'normal'

        spread_ratio = self.spread[0] / self.spread_ma[0]

        if spread_ratio >= self.params.spread_threshold:
            return 'wide'   # Wide range bar, strong momentum or reversal
        elif spread_ratio <= (1 / self.params.spread_threshold): # Inverse threshold for narrow (e.g., 1/1.2 = ~0.83)
            return 'narrow' # Narrow range bar, indecision or lack of interest
        else:
            return 'normal' # Average range bar

    def classify_close_position(self):
        """Classify where the closing price is within the bar's range"""
        if self.spread[0] == 0: # If high == low, it's a flat bar, close is effectively middle
            return 'middle'

        close_pos = self.close_position[0] # Already calculated in __init__

        if close_pos >= 0.7:
            return 'high'   # Close near the high of the bar, strong buying
        elif close_pos <= 0.3:
            return 'low'    # Close near the low of the bar, strong selling
        else:
            return 'middle' # Close in the middle of the bar, indecision

    def get_trend_direction(self):
        """Determine current trend direction based on closing price relative to trend MA"""
        # Ensure trend MA has enough data
        if np.isnan(self.trend_ma[0]):
            return 'sideways'

        if self.close[0] > self.trend_ma[0]:
            return 'up'     # Close above MA, potential uptrend
        elif self.close[0] < self.trend_ma[0]:
            return 'down'   # Close below MA, potential downtrend
        else:
            return 'sideways' # Close at MA, no clear trend

    def detect_vsa_patterns(self):
        """Detect key VSA patterns based on volume, spread, close position, and trend"""
        volume_class = self.classify_volume()
        spread_class = self.classify_spread()
        close_class = self.classify_close_position()
        trend = self.get_trend_direction()

        # Check if current bar is an up bar (close > open) or down bar (close < open)
        is_up_bar = self.close[0] > self.open[0]
        is_down_bar = self.close[0] < self.open[0]

        # Pattern definitions with associated base strength score
        # (Pattern Name, Strength Score, Bullish/Bearish)

        # BULLISH PATTERNS
        # 1. Stopping Volume (Potential reversal from downtrend)
        if (volume_class == 'climax' and spread_class == 'wide' and trend == 'down' and
            is_down_bar and close_class in ['middle', 'high']):
            self.log(f"VSA Pattern: Stopping Volume (Bullish)", dt=self.data.datetime.date(0))
            return 'stopping_volume', 4, 'bullish'

        # 2. No Supply (Low volume test of support in uptrend)
        if (volume_class == 'low' and spread_class == 'narrow' and trend == 'up' and
            is_down_bar and close_class == 'high'): # Low volume down bar, closing high
            self.log(f"VSA Pattern: No Supply (Bullish)", dt=self.data.datetime.date(0))
            return 'no_supply', 3, 'bullish'

        # 3. Strength (Confirmation of buying, often after accumulation)
        if (volume_class == 'high' and spread_class == 'narrow' and trend == 'up' and
            is_up_bar and close_class == 'high'): # High volume, narrow spread, closing high
            self.log(f"VSA Pattern: Strength (Bullish)", dt=self.data.datetime.date(0))
            return 'strength', 2, 'bullish'

        # 4. Effort to Move Up (Low result for high effort implies absorption)
        if (volume_class == 'high' and spread_class == 'narrow' and trend == 'down' and
            is_up_bar and close_class in ['middle', 'low']): # High volume up, but closing low/middle
            self.log(f"VSA Pattern: Effort to Move Up (Bullish Reversal)", dt=self.data.datetime.date(0))
            return 'effort_up_reverse', 3, 'bullish' # Renamed for clarity vs. bearish 'effort up'

        # BEARISH PATTERNS
        # 5. Climax (Potential reversal from uptrend)
        if (volume_class == 'climax' and spread_class == 'wide' and trend == 'up' and
            is_up_bar and close_class in ['middle', 'low']):
            self.log(f"VSA Pattern: Climax (Bearish)", dt=self.data.datetime.date(0))
            return 'climax_sell', 4, 'bearish' # Renamed for clarity

        # 6. No Demand (Low volume test of resistance in downtrend)
        if (volume_class == 'low' and spread_class == 'narrow' and trend == 'down' and
            is_up_bar and close_class == 'low'): # Low volume up bar, closing low
            self.log(f"VSA Pattern: No Demand (Bearish)", dt=self.data.datetime.date(0))
            return 'no_demand', 3, 'bearish'

        # 7. Weakness (Confirmation of selling, often after distribution)
        if (volume_class == 'high' and spread_class == 'narrow' and trend == 'down' and
            is_down_bar and close_class == 'low'): # High volume, narrow spread, closing low
            self.log(f"VSA Pattern: Weakness (Bearish)", dt=self.data.datetime.date(0))
            return 'weakness', 2, 'bearish'

        # 8. Effort to Move Down (Low result for high effort implies buying absorption)
        if (volume_class == 'high' and spread_class == 'narrow' and trend == 'up' and
            is_down_bar and close_class in ['middle', 'high']): # High volume down, but closing high/middle
            self.log(f"VSA Pattern: Effort to Move Down (Bearish Reversal)", dt=self.data.datetime.date(0))
            return 'effort_down_reverse', 3, 'bearish' # Renamed for clarity

        # Neutral or less defined patterns
        return None, 0, 'neutral'

    def check_background_context(self):
        """
        Analyzes recent past bars to provide context for current VSA signals.
        This is a simplified example. A full VSA context analysis is complex.
        """
        context_score = 0

        # Look at the last few bars (e.g., 3-5 bars)
        for i in range(1, min(len(self.data), 6)): # Check up to 5 prior bars
            # Example: Check for high volume on down bars in an uptrend (potential weakness)
            # or low volume on up bars in a downtrend (potential lack of demand)

            # Simplified check for general activity/trend alignment
            prev_volume_ma = bt.indicators.SMA(self.volume, period=self.params.volume_period)(ago=-i)
            prev_spread_ma = bt.indicators.SMA(self.spread, period=self.params.spread_period)(ago=-i)
            prev_trend_ma = bt.indicators.SMA(self.close, period=self.params.trend_period)(ago=-i)

            if not np.isnan(prev_volume_ma) and prev_volume_ma > 0 and self.volume[-i] / prev_volume_ma > 1.5:
                 context_score += 0.5 # High volume in recent past

            if not np.isnan(prev_trend_ma):
                if self.close[-i] > prev_trend_ma and self.close[0] > self.trend_ma[0]: # Consistent uptrend
                    context_score += 0.5
                elif self.close[-i] < prev_trend_ma and self.close[0] < self.trend_ma[0]: # Consistent downtrend
                    context_score += 0.5

        return context_score

    def notify_order(self, order):
        # Log completed orders
        if order.status in [order.Completed]:
            if order.isbuy():
                self.log(f'BUY EXECUTED, Price: {order.executed.price:.2f}, Size: {order.executed.size:.2f}')
                # If a new long position is opened, set initial trailing stop
                if self.position.size > 0: # Check if we actually hold a position now
                    self.entry_price = order.executed.price
                    self.trail_stop_price = self.entry_price * (1 - self.params.trail_stop_pct)
                    self.stop_order = self.sell(exectype=bt.Order.Stop, price=self.trail_stop_price, size=self.position.size)
                    self.log(f'Long Trailing Stop set at {self.trail_stop_price:.2f}')
            elif order.issell():
                self.log(f'SELL EXECUTED, Price: {order.executed.price:.2f}, Size: {order.executed.size:.2f}')
                # If a new short position is opened, set initial trailing stop
                if self.position.size < 0: # Check if we actually hold a short position now
                    self.entry_price = order.executed.price
                    self.trail_stop_price = self.entry_price * (1 + self.params.trail_stop_pct)
                    self.stop_order = self.buy(exectype=bt.Order.Stop, price=self.trail_stop_price, size=abs(self.position.size))
                    self.log(f'Short Trailing Stop set at {self.trail_stop_price:.2f}')

            # Clear the entry order reference after completion
            if self.order and order.ref == self.order.ref:
                self.order = None

        # Handle canceled/rejected orders
        elif order.status in [order.Canceled, order.Rejected, order.Margin]:
            self.log(f'Order {order.getstatusname()} for {order.size} shares.')
            # Clear the entry order reference if it failed
            if self.order and order.ref == self.order.ref:
                self.order = None
            # If a stop order failed, log a warning and clear its reference
            if self.stop_order and order.ref == self.stop_order.ref:
                self.log("WARNING: Trailing Stop Order failed!", doprint=True)
                self.stop_order = None
                # Consider what to do if trailing stop fails - for simplicity, we let next bar handle it

        # Special handling for stop orders filling (when a position is exited)
        if order.status == order.Completed and self.stop_order and order.ref == self.stop_order.ref:
            self.log(f'Trailing Stop Hit! Price: {order.executed.price:.2f}')
            self.stop_order = None
            self.trail_stop_price = 0 # Reset trailing stop tracking
            self.entry_price = 0      # Reset entry price

    def notify_trade(self, trade):
        if not trade.isclosed:
            return
        self.log(f'TRADE P/L: GROSS {trade.pnl:.2f}, NET {trade.pnlcomm:.2f}')


    def next(self):
        # Prevent new orders if an entry order is already pending
        if self.order is not None:
            return

        # Ensure sufficient data for all indicators to be calculated
        # The longest period is trend_period (30) or volume/spread period (7)
        min_bars_needed = max(self.params.trend_period, self.params.volume_period, self.params.spread_period)
        if len(self.data) < min_bars_needed + 1: # +1 because indicators operate on current bar and look back
            return

        current_price = self.close[0]

        # --- Trailing Stop Management ---
        if self.position.size > 0:  # Long position
            # Update current highest price
            if current_price > self.entry_price and self.trail_stop_price > 0: # Ensure price is above entry for profit and stop is active
                new_trail_stop = current_price * (1 - self.params.trail_stop_pct)
                if new_trail_stop > self.trail_stop_price: # Move stop up only
                    self.log(f'Updating long trailing stop from {self.trail_stop_price:.2f} to {new_trail_stop:.2f}')
                    if self.stop_order and self.stop_order.alive(): # Cancel old stop order if it exists and is still active
                        self.cancel(self.stop_order)
                    self.trail_stop_price = new_trail_stop
                    self.stop_order = self.sell(exectype=bt.Order.Stop, price=self.trail_stop_price, size=self.position.size)
            # If price falls below the current trailing stop, let the stop order fire (managed in notify_order)

        elif self.position.size < 0: # Short position
            # Update current lowest price
            if current_price < self.entry_price and self.trail_stop_price > 0: # Ensure price is below entry for profit and stop is active
                new_trail_stop = current_price * (1 + self.params.trail_stop_pct)
                if new_trail_stop < self.trail_stop_price: # Move stop down only
                    self.log(f'Updating short trailing stop from {self.trail_stop_price:.2f} to {new_trail_stop:.2f}')
                    if self.stop_order and self.stop_order.alive(): # Cancel old stop order if it exists and is still active
                        self.cancel(self.stop_order)
                    self.trail_stop_price = new_trail_stop
                    self.stop_order = self.buy(exectype=bt.Order.Stop, price=self.trail_stop_price, size=abs(self.position.size))
            # If price rises above the current trailing stop, let the stop order fire (managed in notify_order)

        # --- VSA Signal Detection and Trading Logic ---

        # Get VSA pattern and its properties for the current bar
        pattern, strength, direction = self.detect_vsa_patterns()

        # If no significant pattern or strength is too low, return
        if pattern is None or strength < 2: # Only consider patterns with a base strength of 2 or more
            return

        # Get background context score
        context_score = self.check_background_context()
        total_strength = strength + context_score

        # Minimum total strength threshold for opening new trades
        if total_strength < 3: # Require a combined strength for entry
            return

        # Prevent trading too frequently based on consecutive signals (e.g., within 5 bars)
        if len(self.data) - self.last_signal_bar < 5:
            return

        # Handle existing positions based on new signals
        if self.position:
            if self.position.size > 0 and direction == 'bearish': # Long position, but bearish VSA signal
                self.log(f'BEARISH VSA Signal ({pattern}) while LONG. Closing position.')
                if self.stop_order is not None and self.stop_order.alive(): # Cancel any pending stop order
                    self.cancel(self.stop_order)
                self.order = self.close() # Close the long position
                self.last_signal_bar = len(self.data)
                self.trail_stop_price = 0 # Reset trailing stop tracking
                self.entry_price = 0
            elif self.position.size < 0 and direction == 'bullish': # Short position, but bullish VSA signal
                self.log(f'BULLISH VSA Signal ({pattern}) while SHORT. Closing position.')
                if self.stop_order is not None and self.stop_order.alive(): # Cancel any pending stop order
                    self.cancel(self.stop_order)
                self.order = self.close() # Close the short position
                self.last_signal_bar = len(self.data)
                self.trail_stop_price = 0 # Reset trailing stop tracking
                self.entry_price = 0

        # Open new positions if currently flat
        else:
            # BULLISH SIGNALS for NEW LONG
            if direction == 'bullish':
                # Further refine entry based on higher confidence signals or overall strength
                if total_strength >= 4 or pattern in ['stopping_volume', 'no_supply']: # Prioritize stronger/key reversal patterns
                    self.log(f'Executing BUY based on VSA pattern: {pattern} (Strength: {total_strength:.1f}) at Close={current_price:.2f}')
                    self.order = self.buy() # Execute buy order (sizer will determine amount)
                    self.last_signal_bar = len(self.data)

            # BEARISH SIGNALS for NEW SHORT
            elif direction == 'bearish':
                # Further refine entry based on higher confidence signals or overall strength
                if total_strength >= 4 or pattern in ['climax_sell', 'weakness', 'no_demand']: # Prioritize stronger/key reversal patterns
                    self.log(f'Executing SELL based on VSA pattern: {pattern} (Strength: {total_strength:.1f}) at Close={current_price:.2f}')
                    self.order = self.sell() # Execute sell (short) order
                    self.last_signal_bar = len(self.data)
Explanation of VSAStrategy:
params: Extensive parameters to control various aspects of VSA calculation (volume/spread periods and thresholds, climax/test multipliers) and strategy behavior (trend period, trailing stop percentage).__init__(self):Initializes references to the raw price and volume data.
Calculates
spread(High-Low range) andclose_position(where the close is within the bar's range). Note thebt.Ifto handle zero spread, preventing division by zero.Initializes
SMAindicators forvolume_ma,spread_ma, andtrend_ma.Initializes variables for tracking VSA signals, trailing stops (
trail_stop_price,entry_price), and orders (self.order,self.stop_order).Helper Functions (
classify_volume,classify_spread,classify_close_position,get_trend_direction): These functions are the core of quantifying VSA. They take the raw data and indicator values and categorize them into meaningful qualitative states (e.g., 'climax' volume, 'wide' spread, 'high' close position, 'up' trend). Robustness checks (e.g.,np.isnan, division by zero) are included.detect_vsa_patterns(self):This is where the VSA patterns are defined based on combinations of the classifications.
Each pattern is assigned a
strengthscore and adirection('bullish', 'bearish', 'neutral').The method logs detected patterns for debugging/analysis.
Self-correction: I’ve renamed
effort_upandeffort_downpatterns toeffort_up_reverseandeffort_down_reverseto better reflect their VSA interpretation as potential reversals when high effort yields poor results, as opposed to direct trend continuation signals. Alsoclimaxtoclimax_sellfor clarity.check_background_context(self):A simplified function to add a “context score” by looking at recent bars. In real VSA, context is highly interpretive, involving identifying phases of accumulation, distribution, etc. This implementation offers a basic quantitative proxy.
notify_order(self, order):Handles order completion and cancellation/rejection.
Crucially: When an entry order (buy/sell) completes, it initializes the
trail_stop_priceand places the actualbt.Order.Stoporder withexectype=bt.Order.Stop. This ensures the trailing stop is active immediately after entry.It also logs updates and resets
self.orderandself.stop_orderreferences appropriately.notify_trade(self, trade): Logs the profit/loss of closed trades.next(self): This is the main logic loop, executed for each new bar.Order Pending Check: Ensures no new orders are placed if an entry order is already active.
Data Sufficiency Check: Verifies that enough bars are available for all indicators to compute valid values.
Trailing Stop Management:
If in a long position, it updates
trail_stop_priceupwards if the current price generates a higher stop. It cancels the old stop order and places a new one.If in a short position, it updates
trail_stop_pricedownwards if the current price generates a lower stop. It cancels the old stop order and places a new one.VSA Signal Processing:
Calls
detect_vsa_patterns()andcheck_background_context()to get pattern, strength, and context.Filters out weak signals based on
strengthandtotal_strength(pattern + context).Includes a
last_signal_barcheck to prevent over-trading on rapid, consecutive signals.Trading Logic (Entry/Exit):
Exiting existing positions: If currently holding a long position and a bearish VSA signal appears, it closes the long. If holding a short and a bullish signal appears, it closes the short. This acts as an early exit based on VSA reversal signs.
Opening new positions: If currently flat (no position), and a strong enough bullish VSA pattern is detected (e.g.,
stopping_volume,no_supplyortotal_strength >= 4), abuy()order is placed. Similarly, for bearish patterns (climax_sell,weakness,no_demandortotal_strength >= 4), asell()(short) order is placed.
4. Rolling Backtesting Framework
The provided run_rolling_backtest function is a robust way to evaluate the strategy's consistency. Instead of a single long backtest, it performs multiple independent backtests over sequential, non-overlapping periods.
# ... (rest of the code for run_rolling_backtest, report_stats, plot_four_charts) ...

def run_rolling_backtest(
    ticker="BTC-USD",
    start="2018-01-01",
    end="2025-12-31", # This will be overridden by current_date in __main__
    window_months=3,
    strategy_params=None
):
    strategy_params = strategy_params or {}
    all_results = []
    start_dt = pd.to_datetime(start)
    end_dt = pd.to_datetime(end)
    current_start = start_dt

    while True:
        current_end = current_start + rd.relativedelta(months=window_months)
        if current_end > end_dt:
            current_end = end_dt # Ensure last window doesn't go past overall end
            if current_start >= current_end: # No valid period left
                break

        print(f"\nROLLING BACKTEST: {current_start.date()} to {current_end.date()}")

        # Data download using yfinance, adhering to saved preferences
        # Using the saved preference: yfinance download with auto_adjust=False and droplevel(axis=1, level=1)
        data = yf.download(ticker, start=current_start, end=current_end, auto_adjust=False, progress=False)

        # Apply droplevel if data is a MultiIndex, as per user's preference
        if isinstance(data.columns, pd.MultiIndex):
            data = data.droplevel(1, axis=1)

        # Check for sufficient data after droplevel for strategy warm-up
        # Get actual strategy parameters for min_bars_needed calculation if overridden
        vol_period = strategy_params.get('volume_period', VSAStrategy.params.volume_period)
        spread_period = strategy_params.get('spread_period', VSAStrategy.params.spread_period)
        trend_period = strategy_params.get('trend_period', VSAStrategy.params.trend_period)

        min_bars_needed = max(vol_period, spread_period, trend_period) + 1

        if data.empty or len(data) < min_bars_needed:
            print(f"Not enough data for period {current_start.date()} to {current_end.date()} (requires at least {min_bars_needed} bars). Skipping.")
            if current_end == end_dt:
                break
            current_start = current_end # Advance to the next window
            continue

        feed = bt.feeds.PandasData(dataname=data)
        cerebro = bt.Cerebro()
        cerebro.addstrategy(strategy, **strategy_params)
        cerebro.adddata(feed)
        cerebro.broker.setcash(100000)
        cerebro.broker.setcommission(commission=0.001)
        cerebro.addsizer(bt.sizers.PercentSizer, percents=95)

        start_val = cerebro.broker.getvalue()
        cerebro.run()
        final_val = cerebro.broker.getvalue()
        ret = (final_val - start_val) / start_val * 100

        all_results.append({
            'start': current_start.date(),
            'end': current_end.date(),
            'return_pct': ret,
            'final_value': final_val,
        })

        print(f"Return: {ret:.2f}% | Final Value: {final_val:.2f}")

        # Move to the next window. If current_end already reached overall end_dt, then break.
        if current_end == end_dt:
            break
        current_start = current_end # For non-overlapping windows, next start is current end

    return pd.DataFrame(all_results)
Explanation of run_rolling_backtest:
Iterative Windows: The
whileloop iterates through the defined overall time range, creatingwindow_months-long segments. The logic correctly handles the last window to not exceed the overallenddate.Data Acquisition:
yf.downloadfetches data for each window, adhering to the user's explicit preference ofauto_adjust=Falseanddroplevel(axis=1, level=1)if a MultiIndex is present.Data Validation: Crucially, it calculates the
min_bars_neededbased on the actual strategy parameters (either defaults orstrategy_paramsoverrides) to ensure enough data for indicator warm-up within each window. It skips periods with insufficient data.Cerebro Setup: For each window, a fresh
bt.Cerebroinstance is created, configured with theVSAStrategy, data feed, initial cash, commission, and a sizer.Execution & Results:
cerebro.run()executes the backtest for the current segment. The start/end dates, percentage return, and final portfolio value are recorded.Window Advancement:
current_startis advanced tocurrent_endfor the next iteration, ensuring non-overlapping backtest periods.
5. Reporting and Visualization
The functions for statistical reporting and plotting are standard and effective for analyzing rolling backtest results.
# ... (rest of the code for report_stats, plot_four_charts) ...

def report_stats(df):
    returns = df['return_pct']
    stats = {
        'Mean Return %': np.mean(returns),
        'Median Return %': np.median(returns),
        'Std Dev %': np.std(returns),
        'Min Return %': np.min(returns),
        'Max Return %': np.max(returns),
        'Sharpe Ratio': np.mean(returns) / np.std(returns) if np.std(returns) > 0 else np.nan
    }
    print("\n=== ROLLING BACKTEST STATISTICS ===")
    for k, v in stats.items():
        print(f"{k}: {v:.2f}")
    return stats

def plot_four_charts(df, rolling_sharpe_window=4):
    """
    Generates four analytical plots for rolling backtest results.
    """
    fig, ((ax1, ax2), (ax3, ax4)) = plt.subplots(2, 2, figsize=(12, 8)) # Adjusted figsize for clarity

    # Calculate period numbers (0, 1, 2, 3, ...)
    periods = list(range(len(df)))
    returns = df['return_pct']

    # 1. Period Returns (Top Left)
    colors = ['green' if r >= 0 else 'red' for r in returns]
    ax1.bar(periods, returns, color=colors, alpha=0.7)
    ax1.set_title('Period Returns', fontsize=14, fontweight='bold')
    ax1.set_xlabel('Period')
    ax1.set_ylabel('Return %')
    ax1.axhline(y=0, color='black', linestyle='-', alpha=0.3)
    ax1.grid(True, alpha=0.3)

    # 2. Cumulative Returns (Top Right)
    cumulative_returns = (1 + returns / 100).cumprod() * 100 - 100
    ax2.plot(periods, cumulative_returns, marker='o', linewidth=2, markersize=4, color='blue') # Smaller markers
    ax2.set_title('Cumulative Returns', fontsize=14, fontweight='bold')
    ax2.set_xlabel('Period')
    ax2.set_ylabel('Cumulative Return %')
    ax2.grid(True, alpha=0.3)

    # 3. Rolling Sharpe Ratio (Bottom Left)
    rolling_sharpe = returns.rolling(window=rolling_sharpe_window).apply(
        lambda x: x.mean() / x.std() if x.std() > 0 else np.nan, raw=False # Added raw=False for lambda
    )
    # Only plot where we have valid rolling calculations
    valid_mask = ~rolling_sharpe.isna()
    valid_periods = [i for i, valid in enumerate(valid_mask) if valid]
    valid_sharpe = rolling_sharpe[valid_mask]

    ax3.plot(valid_periods, valid_sharpe, marker='o', linewidth=2, markersize=4, color='orange') # Smaller markers
    ax3.axhline(y=0, color='red', linestyle='--', alpha=0.5)
    ax3.set_title(f'Rolling Sharpe Ratio ({rolling_sharpe_window}-period)', fontsize=14, fontweight='bold')
    ax3.set_xlabel('Period')
    ax3.set_ylabel('Sharpe Ratio')
    ax3.grid(True, alpha=0.3)

    # 4. Return Distribution (Bottom Right)
    bins = min(15, max(5, len(returns)//2))
    ax4.hist(returns, bins=bins, alpha=0.7, color='steelblue', edgecolor='black')
    mean_return = returns.mean()
    ax4.axvline(mean_return, color='red', linestyle='--', linewidth=2,
                label=f'Mean: {mean_return:.2f}%')
    ax4.set_title('Return Distribution', fontsize=14, fontweight='bold')
    ax4.set_xlabel('Return %')
    ax4.set_ylabel('Frequency')
    ax4.legend()
    ax4.grid(True, alpha=0.3)

    plt.tight_layout()
    plt.show()

if __name__ == '__main__':
    # Using the current date for the end of the backtest for live testing.
    # The current time is Saturday, June 21, 2025 at 12:49:01 AM CEST.
    current_date = pd.to_datetime('2025-06-21').date()

    # Running with default parameters (BTC-USD, 3-month windows)
    # You can uncomment and modify the parameters below to test other configurations
    df = run_rolling_backtest(
        ticker="BTC-USD",
        start="2018-01-01",
        end=current_date, # Use the current date
        window_months=3,

    )

    print("\n=== ROLLING BACKTEST RESULTS ===")
    print(df)

    stats = report_stats(df)
    plot_four_charts(df)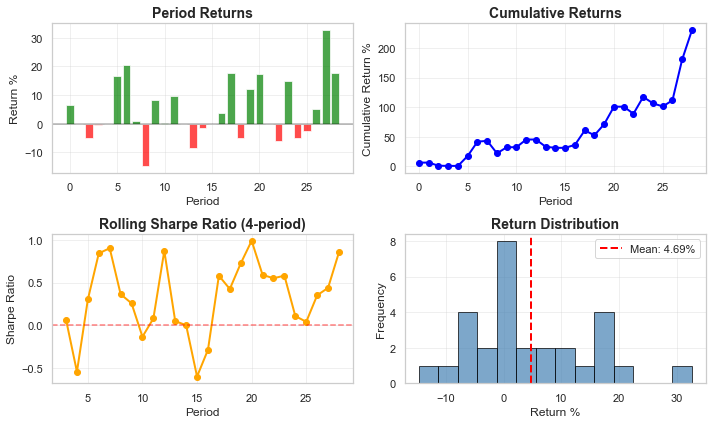
6. Conclusion
The VSAStrategy provides a quantitative approach to Volume Spread Analysis, translating its interpretive principles into actionable trading rules within the backtrader framework. By classifying volume, spread, and close position, and then combining these with trend analysis and background context, the strategy aims to detect market manipulation and shifts in supply/demand dynamics. The integration of a dynamic trailing stop is crucial for risk management, allowing trades to run while protecting accumulated profits. The rolling backtesting methodology offers a rigorous way to evaluate the strategy's consistency and adaptability across various market conditions, providing a more reliable assessment of its long-term viability. Further research could involve refining the pattern definitions, enhancing the context analysis, and optimizing parameters for different assets or timeframes.