
In partnership with

The Supply Chain Crisis Is Escalating — But This Tech Startup Keeps Winning

Global supply chain chaos is intensifying. Major retailers warn of holiday shortages, and tech giants are slashing forecasts as parts dry up.
But while others scramble, one smart home innovator is thriving.
Their strategic move to manufacturing outside China has kept production running smoothly — driving 200% year-over-year growth, even as the industry stalls.
This foresight is no accident. The same leadership team that saw the supply chain storm coming has already expanded into over 120 BestBuy locations, with talks underway to add Walmart and Home Depot.
At just $1.90 per share, this resilient tech startup offers rare stability in uncertain times. As investors flee vulnerable companies, this window is closing fast.
Past performance is not indicative of future results. Email may contain forward-looking statements. See US Offering for details. Informational purposes only.
🚀 Your Investing Journey Just Got Better: Premium Subscriptions Are Here! 🚀
It’s been 4 months since we launched our premium subscription plans at GuruFinance Insights, and the results have been phenomenal! Now, we’re making it even better for you to take your investing game to the next level. Whether you’re just starting out or you’re a seasoned trader, our updated plans are designed to give you the tools, insights, and support you need to succeed.
Here’s what you’ll get as a premium member:
Exclusive Trading Strategies: Unlock proven methods to maximize your returns.
In-Depth Research Analysis: Stay ahead with insights from the latest market trends.
Ad-Free Experience: Focus on what matters most—your investments.
Monthly AMA Sessions: Get your questions answered by top industry experts.
Coding Tutorials: Learn how to automate your trading strategies like a pro.
Masterclasses & One-on-One Consultations: Elevate your skills with personalized guidance.
Our three tailored plans—Starter Investor, Pro Trader, and Elite Investor—are designed to fit your unique needs and goals. Whether you’re looking for foundational tools or advanced strategies, we’ve got you covered.
Don’t wait any longer to transform your investment strategy. The last 4 months have shown just how powerful these tools can be—now it’s your turn to experience the difference.
When I started trading, I was hooked on volume — those little bars at the bottom of the chart seemed like they held all the answers. But honestly, I was clueless about what they were really saying. I’d stare at them, scratch my head, and usually end up on the losing side of a trade. It wasn’t until I stumbled into a better way of reading them — after plenty of trial and error — that my win rate doubled. Now, it’s the backbone of how I’ve pulled in six figures trading.

Why Volume Became My Secret Weapon
Volume’s like the market’s diary — it logs every share that changes hands, no filter. Back in early 2021, I was watching Tesla bounce around $270 after a wild run-up. Price alone wasn’t telling me much, but the volume? That was screaming something big. Unlike price, which can trick you with fake breakouts, volume lays it all bare. It’s how I started spotting what the pros — those institutional traders — were up to, whether they were piling into a stock or cashing out.
This trick, called Volume Price Analysis (VPA), became my lens for seeing if a move had legs or was just hot air. Here’s how I broke it down.
Pay No Interest Until Nearly 2027 AND Earn 5% Cash Back
Use a 0% intro APR card to pay off debt.
Transfer your balance and avoid interest charges.
This top card offers 0% APR into 2027 + 5% cash back!
Step 1: My Volume Setup
Every platform I’ve used — TradingView’s my favorite — has volume built in. It’s just a bar showing how many shares traded in a candle, whether it’s a quick 5-minute one or a full day. I stick to daily or weekly charts because that’s where the big moves hide. Institutions don’t flip stocks in an hour; they take their sweet time.
One day, messing around with NVIDIA at $50, I added a Moving Average (MA) cloud to my volume. It’s like a highlighter for when things get busy. If the bars poke above that cloud, I know the stock’s hotter than usual. I even scribbled some Python to double-check my eyes:
import pandas as pd
import matplotlib.pyplot as plt

# NVIDIA data
data = {'Day': ['01-10', '01-11', '01-12', '01-13'],
        'Volume': [40000, 60000, 95000, 45000]}
df = pd.DataFrame(data)

# Adjusted Moving Average to a smaller window (3-day)
df['MA'] = df['Volume'].rolling(window=3).mean()

# Identifying "hot" days
df['Hot'] = df['Volume'] > df['MA']

# Plotting
plt.figure(figsize=(8, 5))

# Bar chart for Volume
plt.bar(df['Day'], df['Volume'], color='green', alpha=0.7, label='Volume')

# Line chart for Moving Average
plt.plot(df['Day'], df['MA'], color='purple', marker='o', linestyle='dashed', linewidth=2, label='3-day MA')

# Highlighting Hot days
for i in range(len(df)):
    if df['Hot'][i]:  # If "Hot" is True
        plt.text(df['Day'][i], df['Volume'][i] + 2000, '🔥', ha='center', fontsize=12)

# Labels and title
plt.xlabel('Day')
plt.ylabel('Volume')
plt.title('NVIDIA Trading Volume with Moving Average')
plt.legend()
plt.xticks(rotation=45)

# Show plot
plt.show()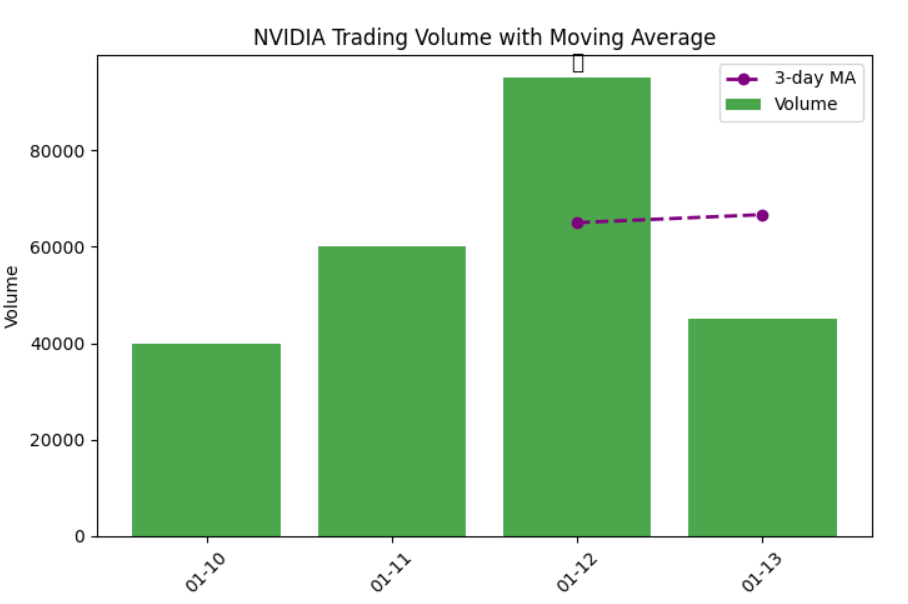
That spike on January 12? Caught my attention big time.
Step 2: Seeing the Pros Sneak In
Accumulation is when the big shots start grabbing a stock quietly. I learned this watching MicroStrategy (MSTR) around $150 in late 2022. The price was scraping a bottom, then bam — huge volume as it crept up, followed by lazy, low-volume days. It hit me: they were buying, not dumping.
It’s like watching someone load up a cart at the store but trying not to draw a crowd. That pattern — high volume on upticks, quiet on dips — became my signal.
Step 3: The Volume Clues I Live By
The best trades I’ve made — like Super Micro Computer (SMCI) from $200 — followed a rhythm:
The Kickoff: A giant volume day, like when SMCI exploded out of nowhere.
The Breather: Price eased off, but volume dried up — no one was selling.
The Push: Volume roared back as the stock took off, hitting $1,000 months later.
I started tinkering with code to catch it early:
import pandas as pd
import matplotlib.pyplot as plt

# Sample data (replace this with your actual df)
data = {
    'Day': [1, 2, 3, 4, 5, 6, 7, 8],
    'Volume': [100, 250, 80, 300, 90, 400, 110, 50],
    'MA': [90, 100, 110, 120, 130, 140, 150, 160]
}

df = pd.DataFrame(data)

# Identify spark and dip points
spark_days = []
dip_days = []
spark_volumes = []
dip_volumes = []

for i in range(1, len(df) - 1):
    if df['Volume'][i] > df['MA'][i] * 2:  # The big day
        if df['Volume'][i + 1] < df['MA'][i + 1]:  # The quiet dip
            spark_days.append(df['Day'][i])
            dip_days.append(df['Day'][i + 1])
            spark_volumes.append(df['Volume'][i])
            dip_volumes.append(df['Volume'][i + 1])

# Plot Volume and Moving Average
plt.figure(figsize=(10, 5))
plt.plot(df['Day'], df['Volume'], marker='o', linestyle='-', label='Volume', color='blue')
plt.plot(df['Day'], df['MA'], marker='s', linestyle='--', label='Moving Average (MA)', color='orange')

# Highlight sparks
plt.scatter(spark_days, spark_volumes, color='red', label='Spark (Big Day)', s=100, marker='^')

# Highlight dips
plt.scatter(dip_days, dip_volumes, color='green', label='Dip (Quiet Dip)', s=100, marker='v')

# Labels and legend
plt.xlabel('Day')
plt.ylabel('Volume')
plt.title('Spark and Dip Detection')
plt.legend()
plt.grid(True)

# Show the graph
plt.show()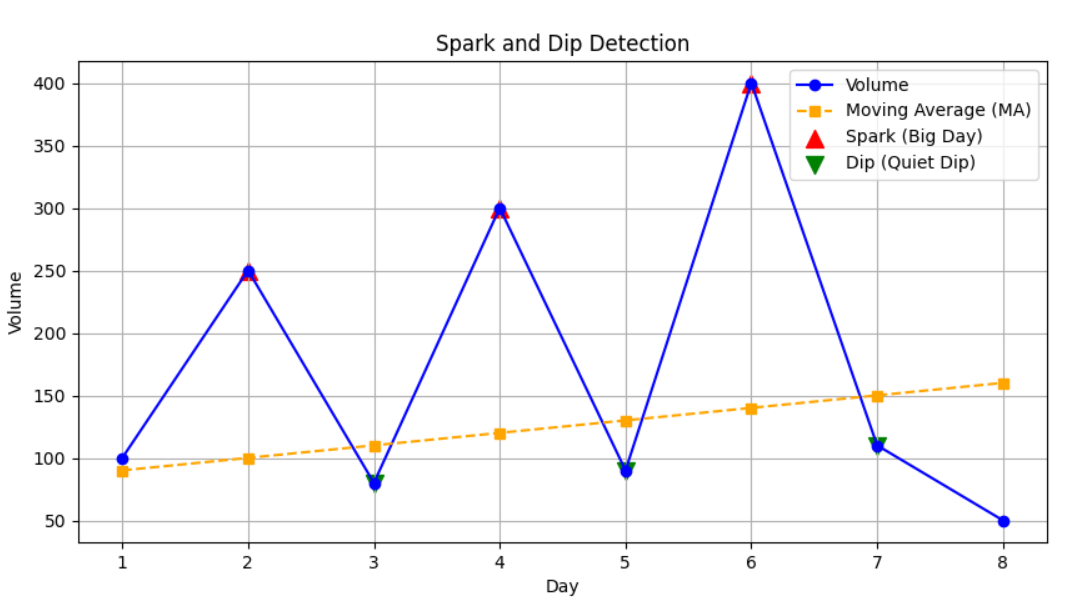
Step 4: Matching It with Price
Volume alone isn’t enough — I pair it with price action. Take Tesla at $270 in 2023. After a volume surge, it settled into a bull flag — a tight little pause that looked ready to pop. I’ve seen it with wedges and pennants too. It’s like the stock’s coiling up, waiting for the green light.
Step 5: Jumping In at the Right Moment
For entries, I pick a line in the sand — like $146 on MSTR. It’d bounced off that level twice before, so when it broke through with volume blasting, I knew it was go-time. I’d check the 5-minute chart: first close above $146, I’m in. Stop loss? The daily low, maybe $143, to keep my downside tight.
I tested it with a quick script:
import matplotlib.pyplot as plt

# Data
trigger = 146
prices = [144, 145, 146.2, 147]  # 5-min closes
stop = 143
entry_price = None

time_intervals = list(range(len(prices)))  # Assuming time points as indices

# Find entry price
for price in prices:
    if price > trigger:
        entry_price = price
        break

# Plot price movement
plt.figure(figsize=(8, 5))
plt.plot(time_intervals, prices, marker='o', linestyle='-', label='Price Movement')

# Mark entry point
if entry_price:
    entry_index = prices.index(entry_price)
    plt.scatter(entry_index, entry_price, color='red', s=100, label=f'Entry at {entry_price}')
    plt.axhline(y=stop, color='blue', linestyle='dashed', label=f'Stop at {stop}')

# Labels and title
plt.xlabel("Time Intervals")
plt.ylabel("Price")
plt.title("Trade Entry Visualization")
plt.legend()
plt.grid()
plt.show()Start
│
▼
Initialize:
trigger = 146
prices = [144, 145, 146.2, 147]
stop = 143
│
▼
Loop through prices:
┌───────────┐
│ price = 144 │
└───────────┘
│
▼
144 > 146 ? ✗ (No) → Continue loop
│
▼
┌───────────┐
│ price = 145 │
└───────────┘
│
▼
145 > 146 ? ✗ (No) → Continue loop
│
▼
┌────────────┐
│ price = 146.2 │
└────────────┘
│
▼
146.2 > 146 ? ✓ (Yes) → Print:
"In at 146.2, stop at 143"
│
▼
Break loop
│
▼
End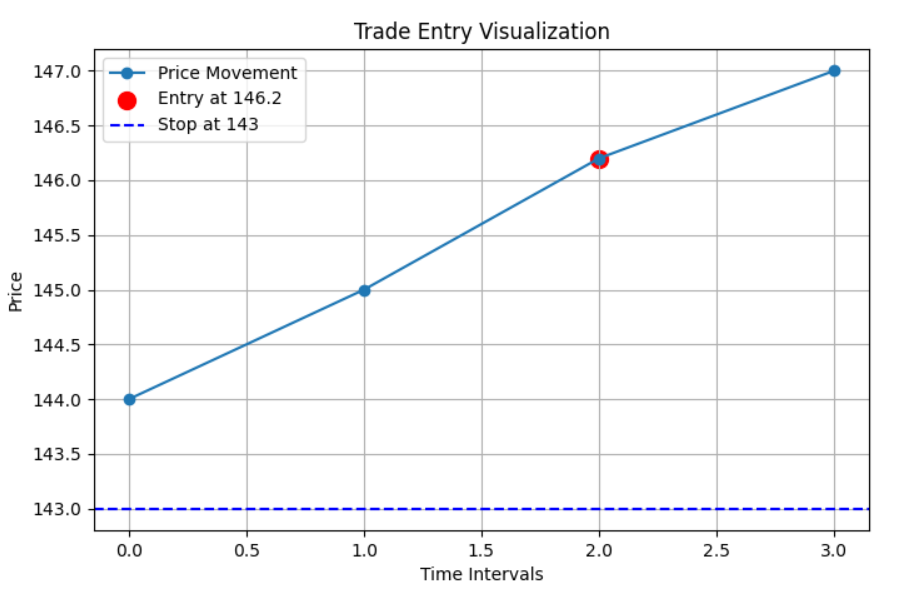
That trade ran to $450 — crazy ride.
Step 6: Locking In the Wins
Cashing out’s where I keep it practical. On MSTR, I sold chunks at old highs — $200, $300 — peeling off 25% each time. When SMCI hit uncharted territory, I used Fibonacci levels to guess where it’d pause, trimming as it climbed. After the first sale, I’d slide my stop to breakeven and let it ride.
The Payoff
This isn’t foolproof — nothing is. But it’s how I nabbed NVIDIA from $50 to over $100, Tesla from $270 to $480, and more. Volume’s like a friend who doesn’t sugarcoat it. When I missed it — like dumping NVDA too early — I’d kick myself. But when I stuck to the plan, it paid off big.
My Takeaway
Learning volume turned my trading from a coin flip to something I could lean on. It’s not just bars — it’s the market spilling its guts. Next time you’re eyeing a stock, pull up a daily chart, watch those volume spikes, and see what story it’s telling you. It worked for me — maybe it’ll work for you too.